More pointers to help in identifying whether its accumulation or Distribution.
Lest some charlie jumps to point out, let me make it clear that I haven't invented anything in stock market, all my knowledge of stock market comes from old farts. Just my observation is my own. https://t.co/uHNw8tV4AO
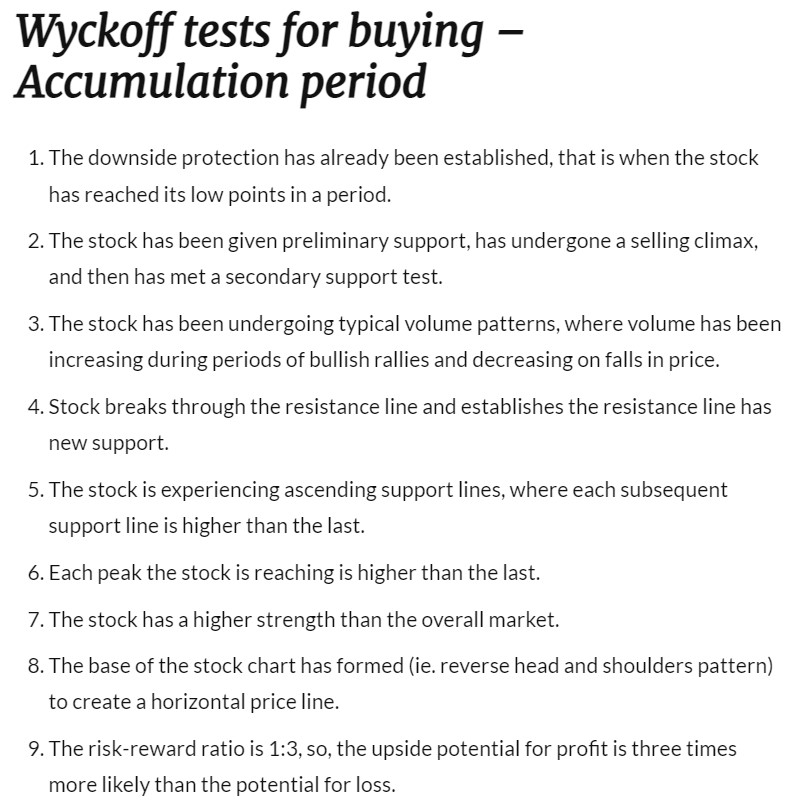
Plz advice how to identify accumulation and distribution phase...... to me Both looks same
— VIVEK VAID (@bobvaid) February 12, 2022
More from Professor
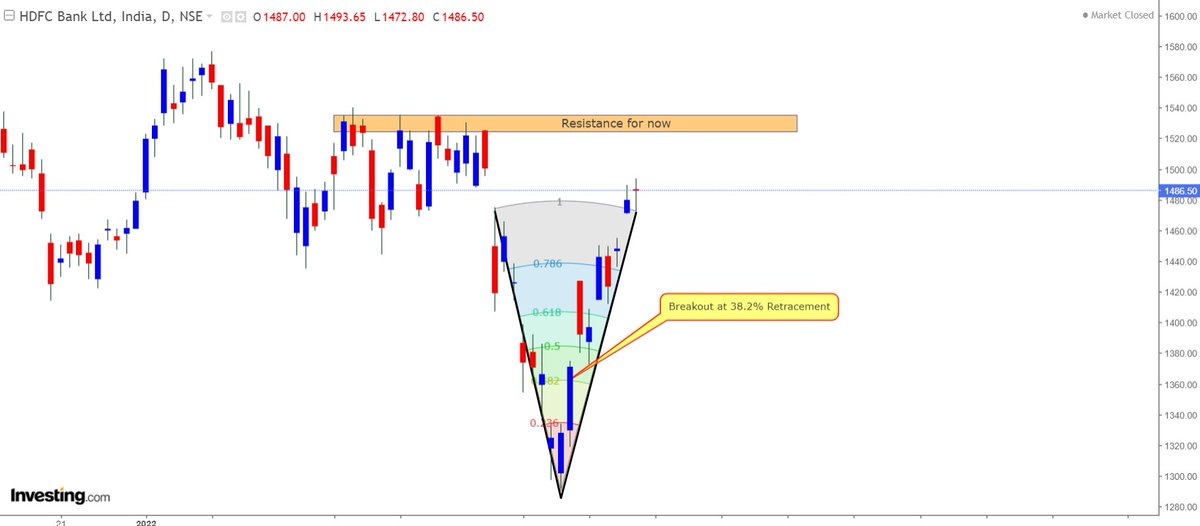
One of the best way that I know is ATR based trailing.
Here is an example https://t.co/BTATx5fyW6
An example of ATR based TSL.
— Professor (@DillikiBiili) April 9, 2021
SL for coming candle is Low of the just completed candle - ATR of previous candle. Chart is self explanatory. https://t.co/D95iv4t5j6 pic.twitter.com/e8BkO2j5rn
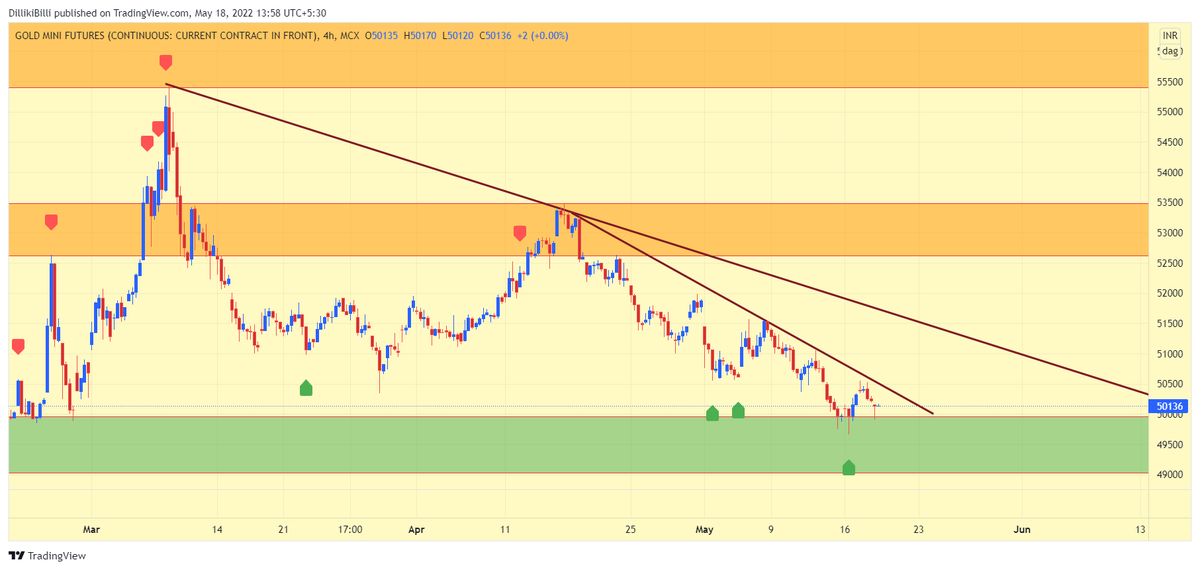
Gold is down for now, but every time demand is coming from the support zone.
— Professor (@DillikiBiili) May 8, 2022
I am bullish on Gold for long terms, as per me it would break its ATH resistance, my expected target is BRN of USD 3K/Oz. https://t.co/XT1l48pEx5 pic.twitter.com/8ViSeIPDzN
More from Screeners


A thread on some features that will help you trade and invest better😀👇
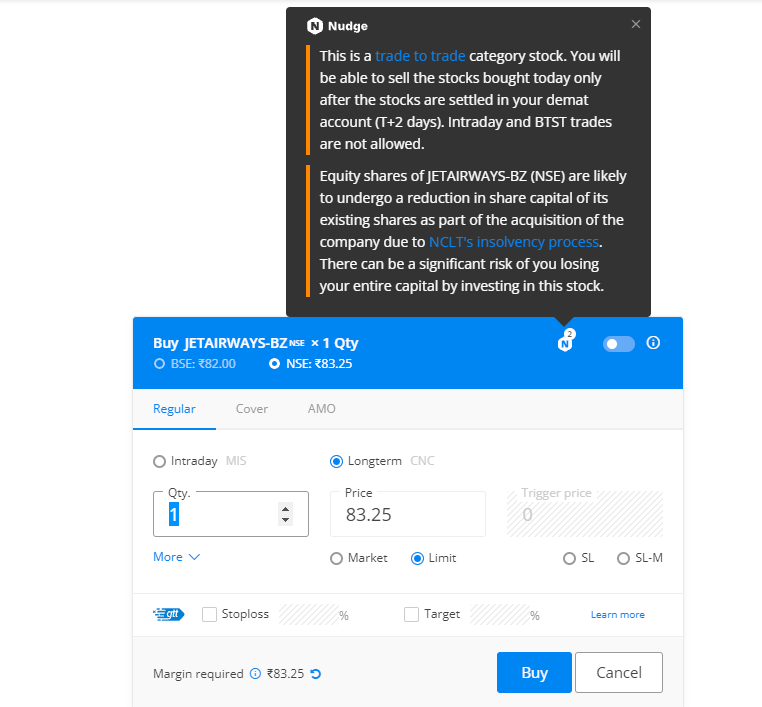
With Nudges, our aim is to help users avoid mistakes at the point of decision-making. We’ll nudge you when you’re about to make a mistake like buy dubious stocks, trade illiquid scrips, stocks with corporate actions etc. Here are a few Nudges that have helped users the most👇
With GTT, you can place long-standing orders. You can place a target and a stop loss for the stocks you buy so that you don’t have to track the prices every day. The orders will remain active until triggered*🏖
If you trade large quantities of scrips with freeze quantity, for example, you'll have to open the order window each time. With sticky order window, the order form remains open even after you place an order so that you can quickly place multiple
Normally after you place an order, the order window closes. With the Sticky order window, the order window remains open, making it easy to place multiple orders with the same input with just one click\u26a1rather than doing it all over again. This helps overcome qty freeze limits. pic.twitter.com/65kXY4h9f0
— Zerodha (@zerodhaonline) November 15, 2021
With the Positions Analysis tool by @BeSensibull, you can see Max loss, Max profit, Breakeven probability of profit, Greeks, IVs and much more right on Kite.
You can also change the price and expiry to see how much you'll gain or lose.
Here I will share what I believe are essentials for anybody who is interested in stock markets and the resources to learn them, its from my experience and by no means exhaustive..
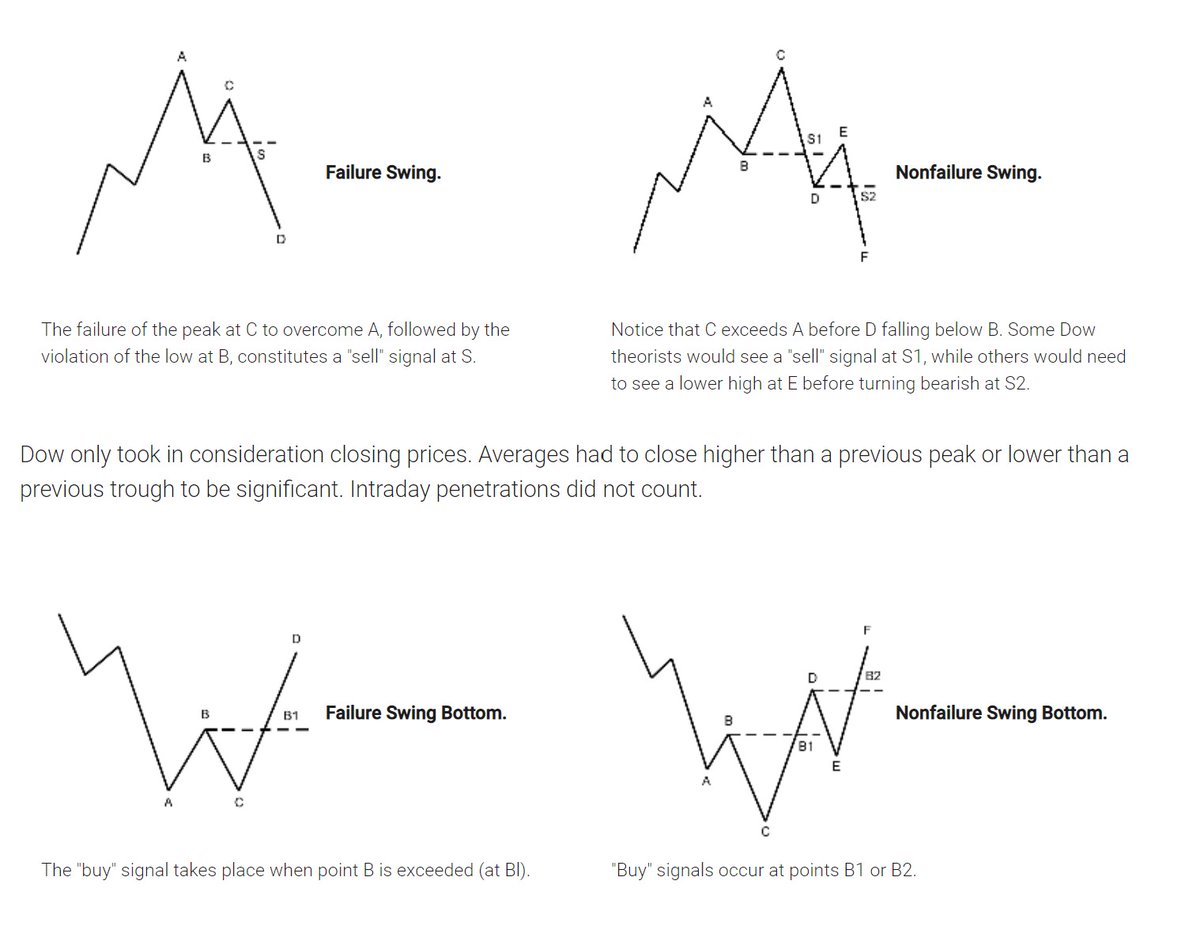
First the very basic : The Dow theory, Everybody must have basic understanding of it and must learn to observe High Highs, Higher Lows, Lower Highs and Lowers lows on charts and their
Even those who are more inclined towards fundamental side can also benefit from Dow theory, as it can hint start & end of Bull/Bear runs thereby indication entry and exits.
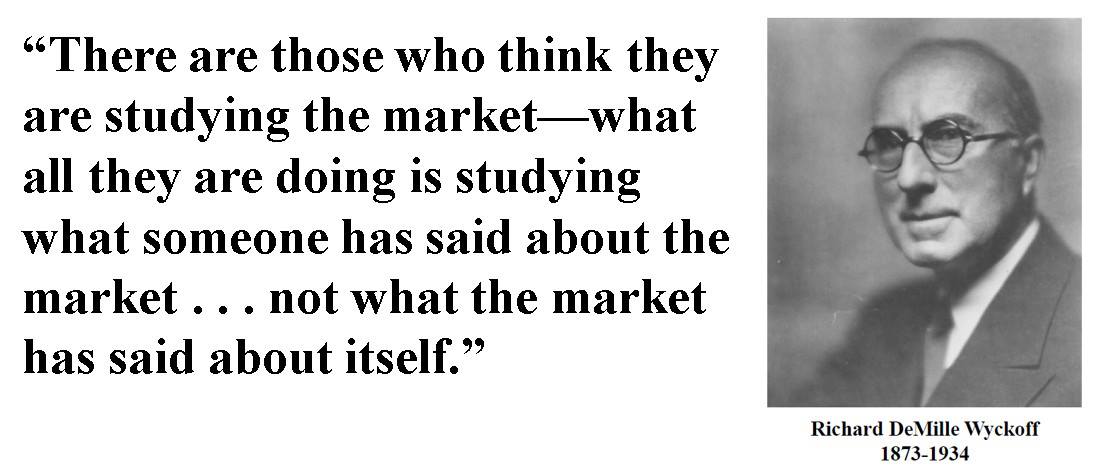
Next basic is Wyckoff's Theory. It tells how accumulation and distribution happens with regularity and how the market actually
Dow theory is old but
Old is Gold....
— Professor (@DillikiBiili) January 23, 2020
this Bharti Airtel chart is a true copy of the Wyckoff Pattern propounded in 1931....... pic.twitter.com/tQ1PNebq7d