Of all the bullish combinations that can work on Nifty, Bank Nifty+ Reliance combination is the most potent one.
But then what else will take Nifty to 35000+ in 2-3 years.
More from Mayank Narula
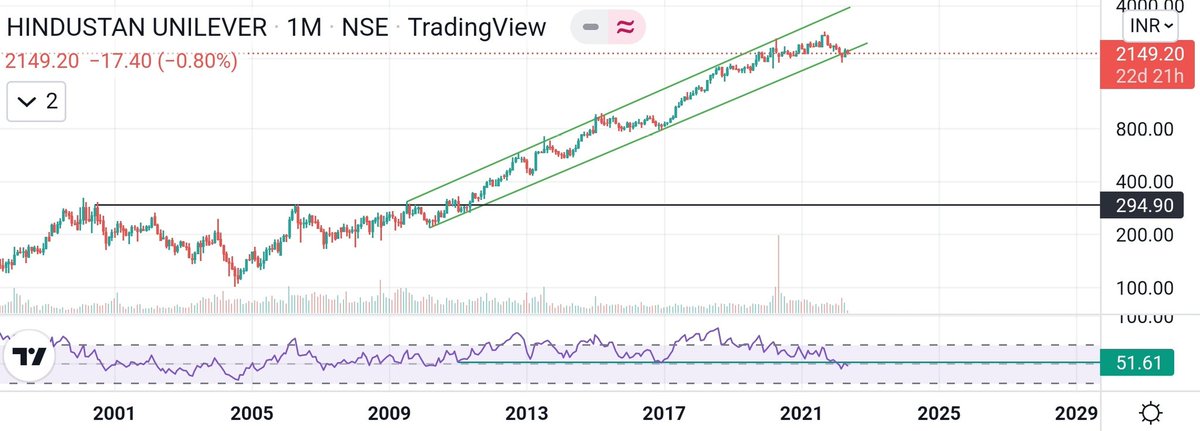
I will be a buyer under 13800 levels, but depending upon the reversal on smaller timeframe.
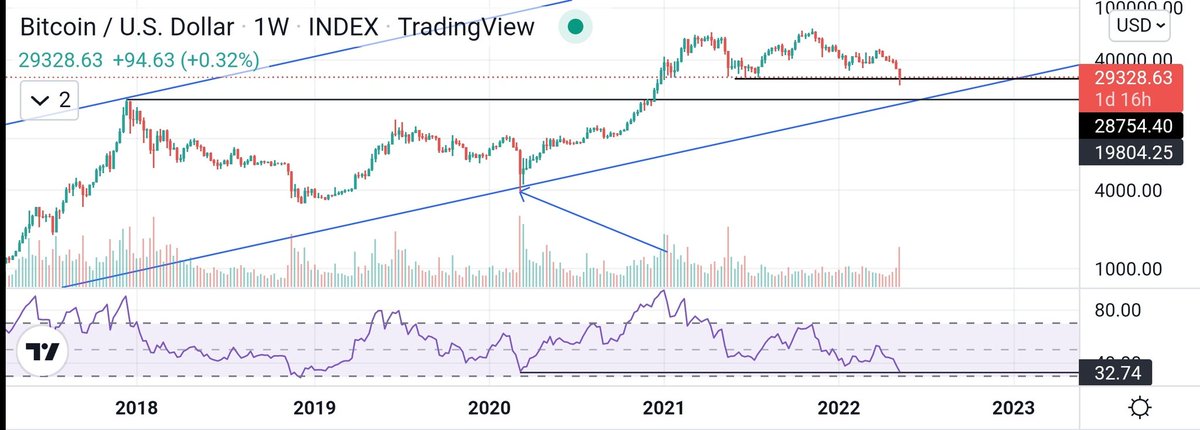
#BITCOIN
— Mayank Narula (@Mayank_Narula1) March 5, 2022
Pending RSI divergence on monthly chart which requires a dip under 13805 to get resolved.
But monthly RSI divergences can go on for years before the resolution.
Best case scenario will be panic dump over next few months. pic.twitter.com/hi67hMg9sZ
#Nifty
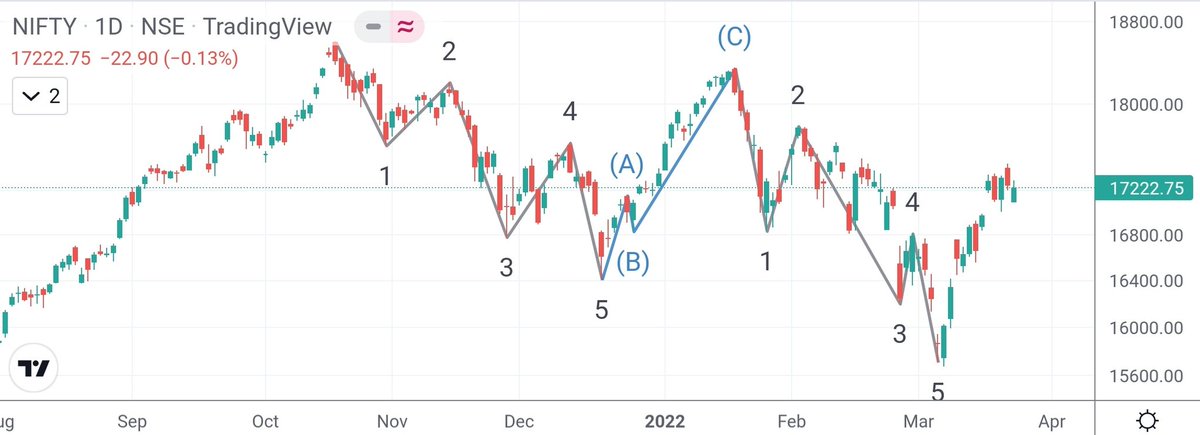
So now that Nifty has undergone ABC correction in the expected manner, what to expect next?
I think we have started larger degree wave 3, once 16800 was crossed.
16800 is the reference level now. We will get more sense by end of next week/ month. https://t.co/KsziuUpZxU
#NIFTY
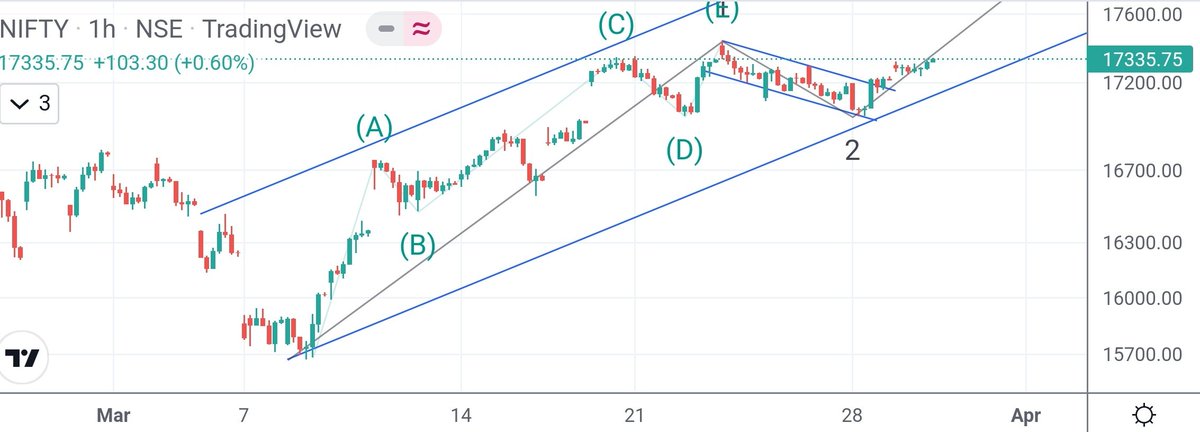
If 17445 is taken out, then may be we are heading to fresh new all time on Nifty.
Things may pan out way faster than expected.
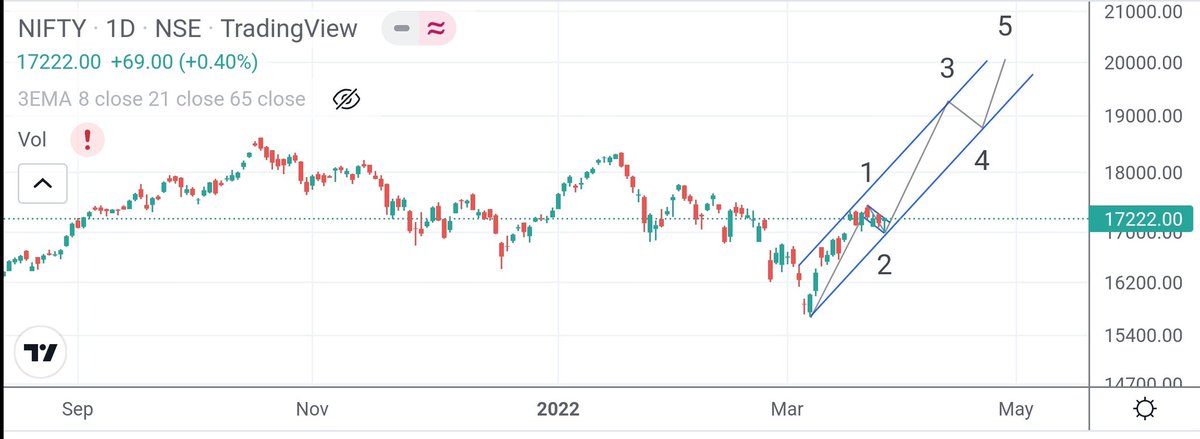
#NIFTY
Zoomed in cross-section of the chart above.
Wave 3 of 1 should have started today, which can take Nifty to fresh all time highs.
#NIFTY
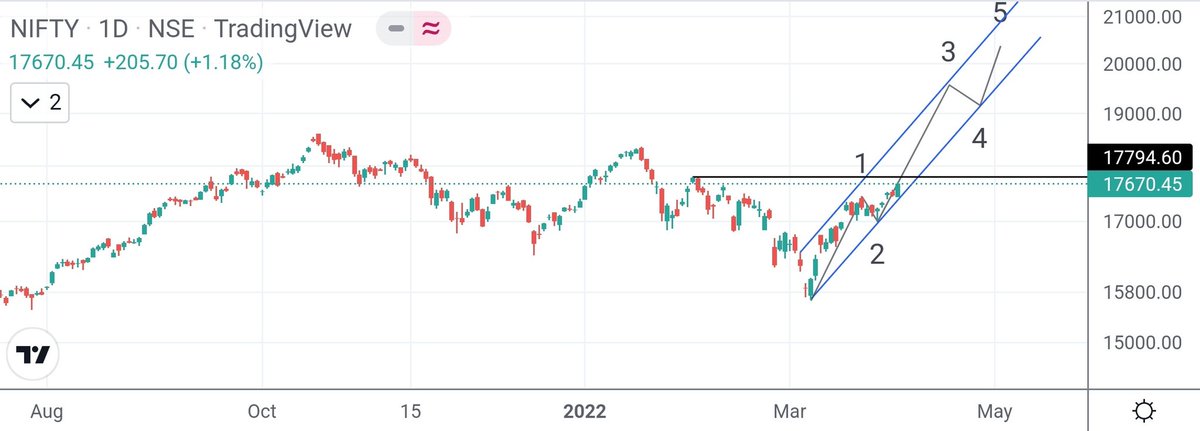
So now Nifty is moving more clearly on the expected path, what's next?
Nifty has started longer term wave 3 advancement, pending final confirmation of HH by crossing 17800.
In Wave 1 of 3, can expect a move to 20k+.
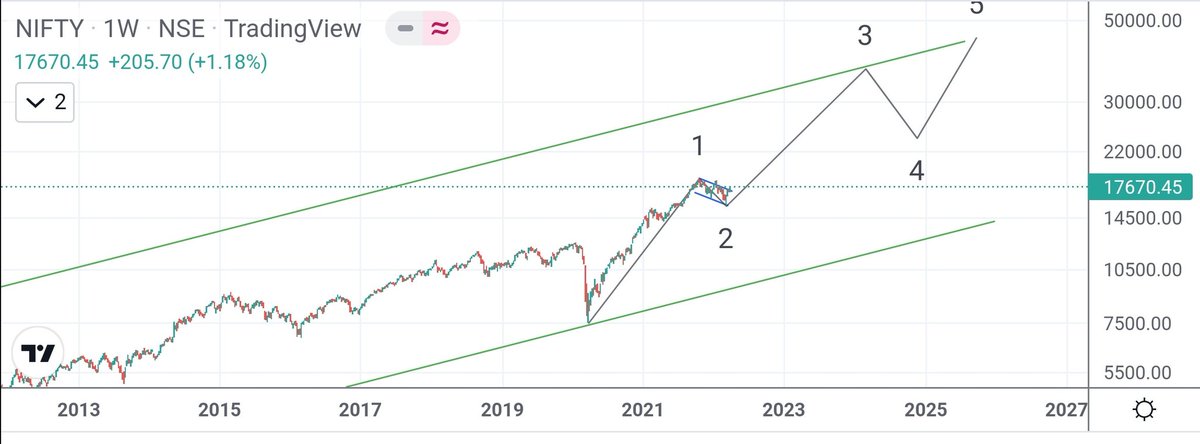
In terms of longer term wave structure:
Wave 1: 7500 to 18600
Wave 3: 15700 to 35000+
And this can pan out over next 2 years or so.
Since wave 2 was a shallow correction, wave 4 can potentially be a deeper correction.
So now that Nifty has undergone ABC correction in the expected manner, what to expect next?
I think we have started larger degree wave 3, once 16800 was crossed.
16800 is the reference level now. We will get more sense by end of next week/ month. https://t.co/KsziuUpZxU
I am no expert in Wave Theory, but can this be a possible path over next few weeks/months?
— Mayank Narula (@Mayank_Narula1) December 6, 2021
Views requested. @idineshptl @indiacharts @nishkumar1977 pic.twitter.com/u3DjEeqoqB
#NIFTY
If 17445 is taken out, then may be we are heading to fresh new all time on Nifty.
Things may pan out way faster than expected.
#NIFTY
Zoomed in cross-section of the chart above.
Wave 3 of 1 should have started today, which can take Nifty to fresh all time highs.
#NIFTY
So now Nifty is moving more clearly on the expected path, what's next?
Nifty has started longer term wave 3 advancement, pending final confirmation of HH by crossing 17800.
In Wave 1 of 3, can expect a move to 20k+.
In terms of longer term wave structure:
Wave 1: 7500 to 18600
Wave 3: 15700 to 35000+
And this can pan out over next 2 years or so.
Since wave 2 was a shallow correction, wave 4 can potentially be a deeper correction.
More from Screeners


On the occasion of youtube 20k and Twitter 70k members
A small tribute/gift to members
Screeners
technical screeners - intraday and positional both
before proceeding - i have helped you , can i ask you so that it can help someone else too
thank you
positional one
run - find #stock - draw chart - find levels
1- Stocks closing daily 2% up from 5 days
https://t.co/gTZrYY3Nht
2- Weekly breakout
https://t.co/1f4ahEolYB
3- Breakouts in short term
https://t.co/BI4h0CdgO2
4- Bullish from last 5
intraday screeners
5- 15 minute Stock Breakouts
https://t.co/9eAo82iuNv
6- Intraday Buying seen in the past 15 minutes
https://t.co/XqAJKhLB5G
7- Stocks trading near day's high on 5 min chart with volume BO intraday
https://t.co/flHmm6QXmo
Thank you
A small tribute/gift to members
Screeners
technical screeners - intraday and positional both
before proceeding - i have helped you , can i ask you so that it can help someone else too
thank you
positional one
run - find #stock - draw chart - find levels
1- Stocks closing daily 2% up from 5 days
https://t.co/gTZrYY3Nht
2- Weekly breakout
https://t.co/1f4ahEolYB
3- Breakouts in short term
https://t.co/BI4h0CdgO2
4- Bullish from last 5
intraday screeners
5- 15 minute Stock Breakouts
https://t.co/9eAo82iuNv
6- Intraday Buying seen in the past 15 minutes
https://t.co/XqAJKhLB5G
7- Stocks trading near day's high on 5 min chart with volume BO intraday
https://t.co/flHmm6QXmo
Thank you