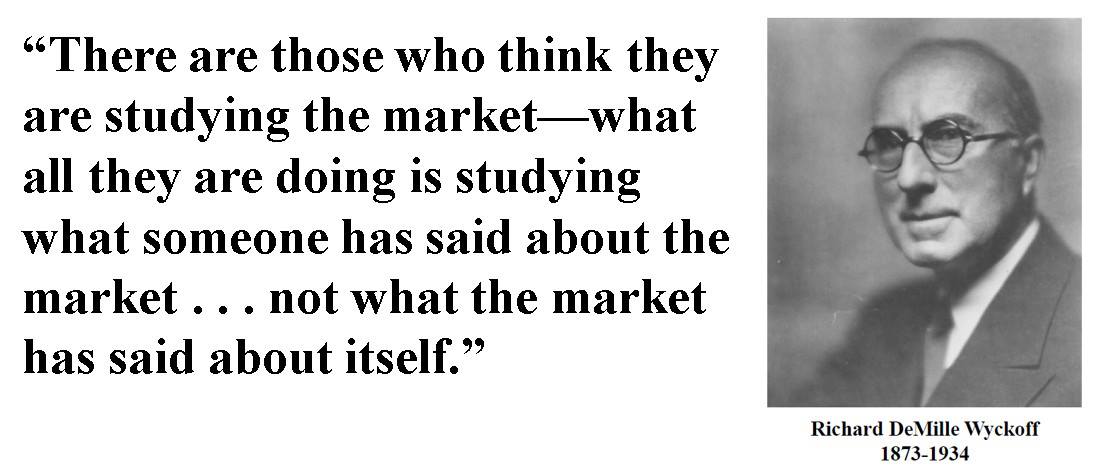
A Crash course on Wyckoff Methodology - More than 100 year old, time tested and age proven methodology for Buying and Selling Stocks.
This is what Darvas and Jesse Livermore also followed.
https://t.co/XiWmRoWveh
More from Professor
Good Books for learning Price Action.
First two are good enough, if you want to really go in depth then go for 3rd one by Al Brooks later (Its only for serious and committed learners, as its too detailed and would tire out a casual reader). https://t.co/2Vgq5gCVXL
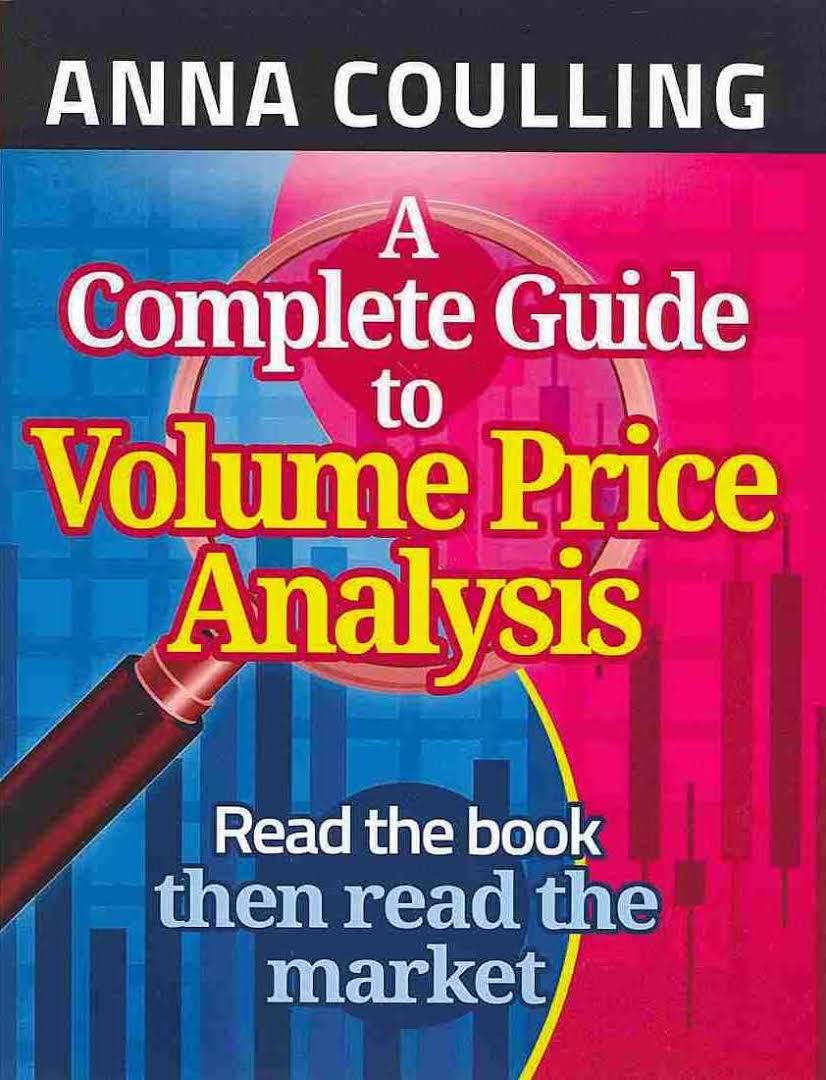
First two are good enough, if you want to really go in depth then go for 3rd one by Al Brooks later (Its only for serious and committed learners, as its too detailed and would tire out a casual reader). https://t.co/2Vgq5gCVXL
Book name plz
— \ufe0e (@12354368ys_g) March 4, 2022

Objective Methods to Exit/Book Profit:
1. Darvas Box System
2. ATR based trailing
3. PSAR based trailing
4. EMA Crossover based trailing
1. Darvas Box System
2. ATR based trailing
3. PSAR based trailing
4. EMA Crossover based trailing
Okay sir but dusre konse method se exit ya profit book kar sakte hai sir sry apako bohot pareshan kar raha hu but sry sir
— learner \u2600\ufe0f\u2600\ufe0f (@darvaxfan1845) March 12, 2022

More from Screeners







You May Also Like


Tip from the Monkey
Pangolins, September 2019 and PLA are the key to this mystery
Stay Tuned!
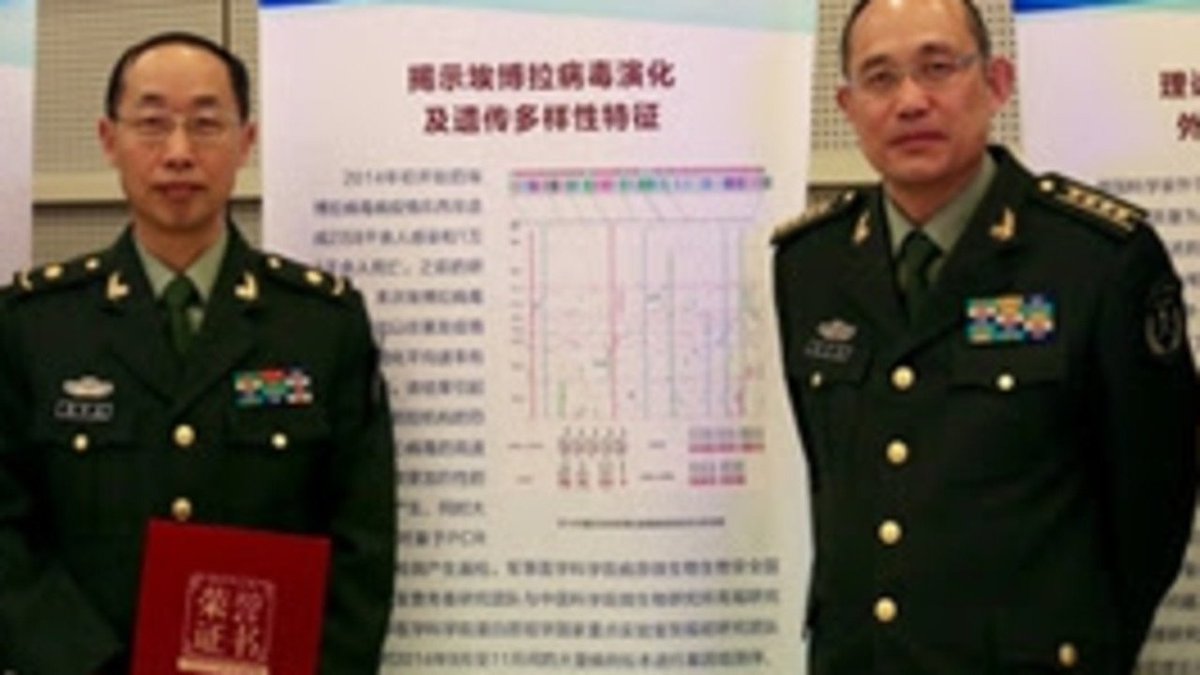
1. Yang
2. A jacobin capuchin dangling a flagellin pangolin on a javelin while playing a mandolin and strangling a mannequin on a paladin's palanquin, said Saladin
More to come tomorrow!
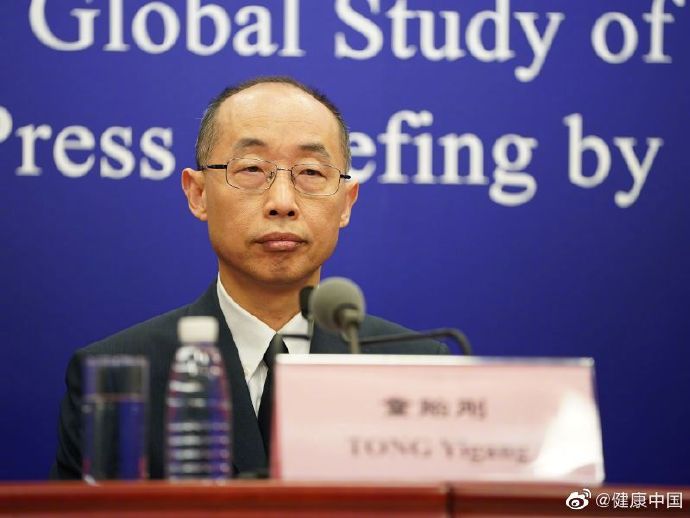
3. Yigang Tong
https://t.co/CYtqYorhzH
Archived: https://t.co/ncz5ruwE2W
4. YT Interview
Some bats & pangolins carry viruses related with SARS-CoV-2, found in SE Asia and in Yunnan, & the pangolins carrying SARS-CoV-2 related viruses were smuggled from SE Asia, so there is a possibility that SARS-CoV-2 were coming from
Pangolins, September 2019 and PLA are the key to this mystery
Stay Tuned!
1. Yang
Meet Yang Ruifu, CCP's biological weapons expert https://t.co/JjB9TLEO95 via @Gnews202064
— Billy Bostickson \U0001f3f4\U0001f441&\U0001f441 \U0001f193 (@BillyBostickson) October 11, 2020
Interesting expose of China's top bioweapons expert who oversaw fake pangolin research
Paper 1: https://t.co/TrXESKLYmJ
Paper 2:https://t.co/9LSJTNCn3l
Pangolinhttps://t.co/2FUAzWyOcv pic.twitter.com/I2QMXgnkBJ
2. A jacobin capuchin dangling a flagellin pangolin on a javelin while playing a mandolin and strangling a mannequin on a paladin's palanquin, said Saladin
More to come tomorrow!
3. Yigang Tong
https://t.co/CYtqYorhzH
Archived: https://t.co/ncz5ruwE2W
4. YT Interview
Some bats & pangolins carry viruses related with SARS-CoV-2, found in SE Asia and in Yunnan, & the pangolins carrying SARS-CoV-2 related viruses were smuggled from SE Asia, so there is a possibility that SARS-CoV-2 were coming from