#INDICATORS
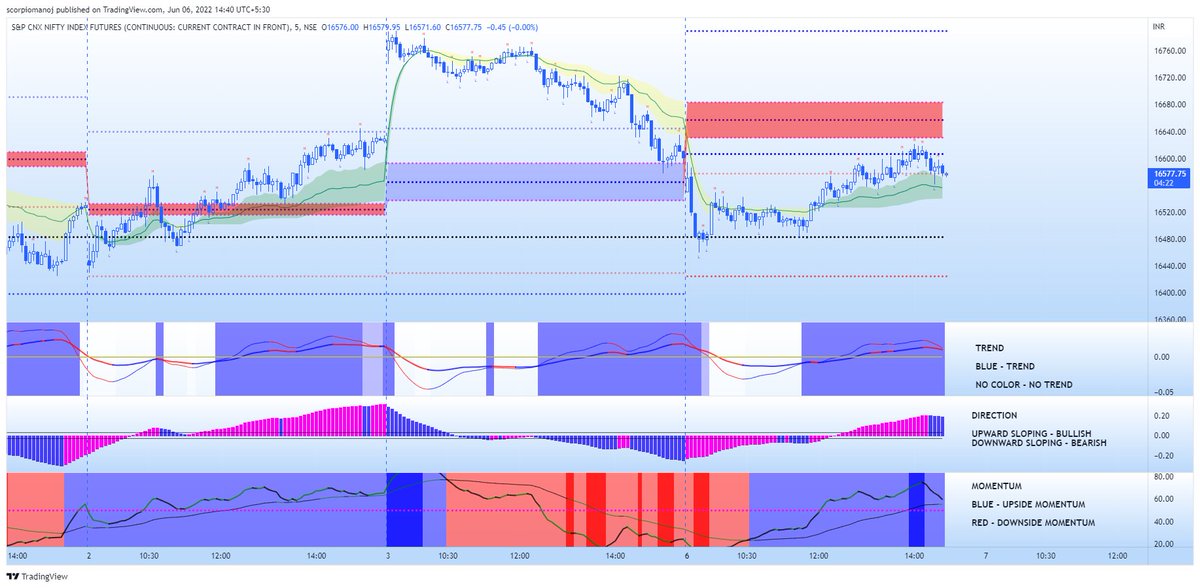
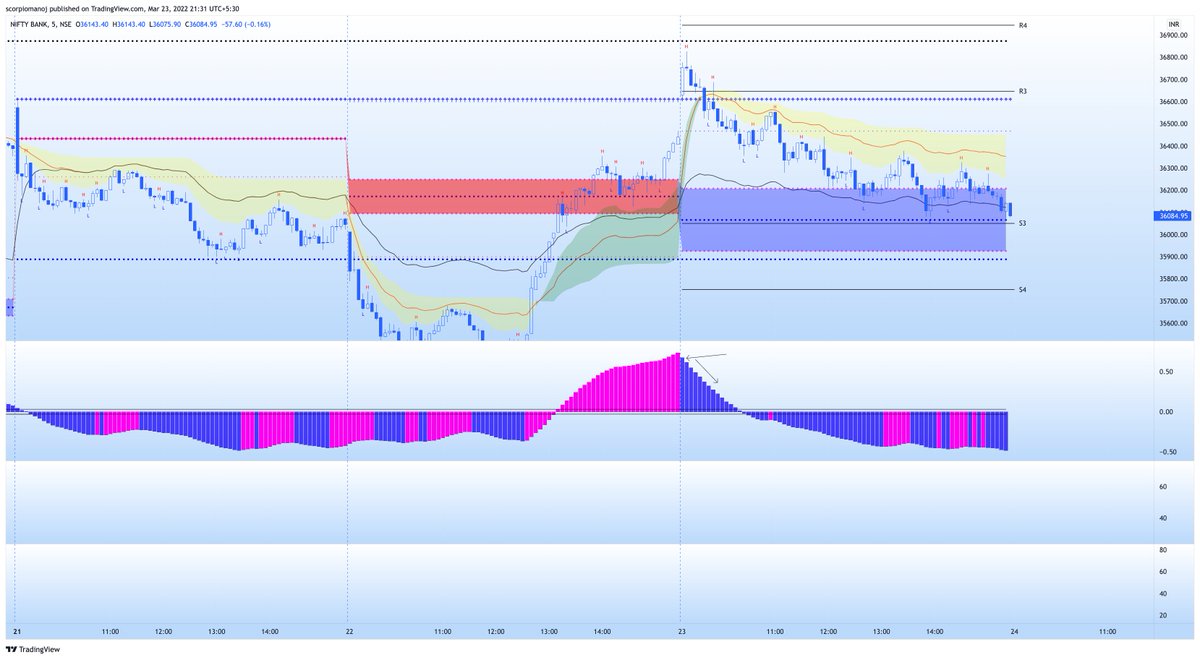
Intraday trading is all about identifying 3 components 1) Trend 2) Direction 3) Momentum
(TDM).
Trend - Developing cpr width
Direction - PivotShiftIndicator
Momentum - PivotRSI.
Just finished devloping color codes for identifying trades based on TDM.
More from ScorpioManoj
More from Screeners

This scan will give you linear/smooth/non-choppy trends which are great for pullback trades for working people.
#BroTip
#BroTip
If you want to trade only stocks with established trend/momentum, then you can look for stocks which have never(or barely did) closed below a certain MA (say 50MA) in the last say 50 days.
— Manas Arora (@iManasArora) November 8, 2021
There are countless ways to run scans. Just have to get creative. #BroTip

If you’ve opened your Zerodha account recently, you may not know about some of the cool features we have across all the Zerodha products and platforms.
A thread on some features that will help you trade and invest better😀👇
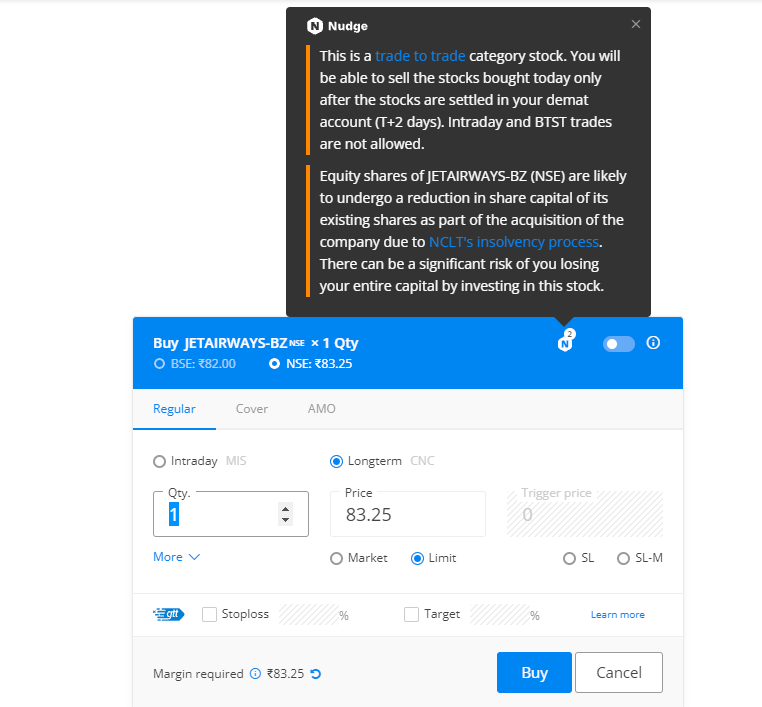
With Nudges, our aim is to help users avoid mistakes at the point of decision-making. We’ll nudge you when you’re about to make a mistake like buy dubious stocks, trade illiquid scrips, stocks with corporate actions etc. Here are a few Nudges that have helped users the most👇
With GTT, you can place long-standing orders. You can place a target and a stop loss for the stocks you buy so that you don’t have to track the prices every day. The orders will remain active until triggered*🏖
If you trade large quantities of scrips with freeze quantity, for example, you'll have to open the order window each time. With sticky order window, the order form remains open even after you place an order so that you can quickly place multiple
With the Positions Analysis tool by @BeSensibull, you can see Max loss, Max profit, Breakeven probability of profit, Greeks, IVs and much more right on Kite.
You can also change the price and expiry to see how much you'll gain or lose.
A thread on some features that will help you trade and invest better😀👇
With Nudges, our aim is to help users avoid mistakes at the point of decision-making. We’ll nudge you when you’re about to make a mistake like buy dubious stocks, trade illiquid scrips, stocks with corporate actions etc. Here are a few Nudges that have helped users the most👇
With GTT, you can place long-standing orders. You can place a target and a stop loss for the stocks you buy so that you don’t have to track the prices every day. The orders will remain active until triggered*🏖
If you trade large quantities of scrips with freeze quantity, for example, you'll have to open the order window each time. With sticky order window, the order form remains open even after you place an order so that you can quickly place multiple
Normally after you place an order, the order window closes. With the Sticky order window, the order window remains open, making it easy to place multiple orders with the same input with just one click\u26a1rather than doing it all over again. This helps overcome qty freeze limits. pic.twitter.com/65kXY4h9f0
— Zerodha (@zerodhaonline) November 15, 2021
With the Positions Analysis tool by @BeSensibull, you can see Max loss, Max profit, Breakeven probability of profit, Greeks, IVs and much more right on Kite.
You can also change the price and expiry to see how much you'll gain or lose.