More from JayneshKasliwal


𝗛𝗼𝘄 𝘁𝗼 𝗰𝗿𝗲𝗮𝘁𝗲 𝘆𝗼𝘂𝗿 𝗼𝘄𝗻 𝗖𝗵𝗮𝗿𝘁𝗶𝗻𝗸 𝗦𝗰𝗿𝗲𝗲𝗻𝗲𝗿
🧵 Thread 🧵
[1/15]
𝗖𝗵𝗮𝗿𝘁𝗶𝗻𝗸 𝗦𝗰𝗿𝗲𝗲𝗻𝗲𝗿 is a Stock screening tool that is useful to screen stocks based on Technical & Fundamentals.
🔸 It scans stocks by using technical indicators like RSI, MACD, divergences, etc.
🔸 It also uses fundamental tools like Book Value, EPS,PE etc
[2/15]
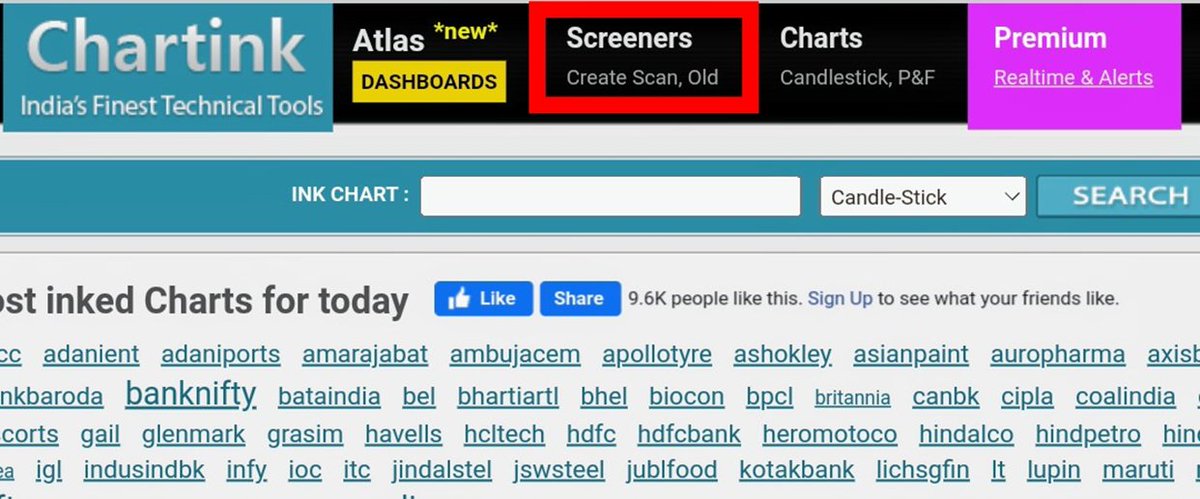
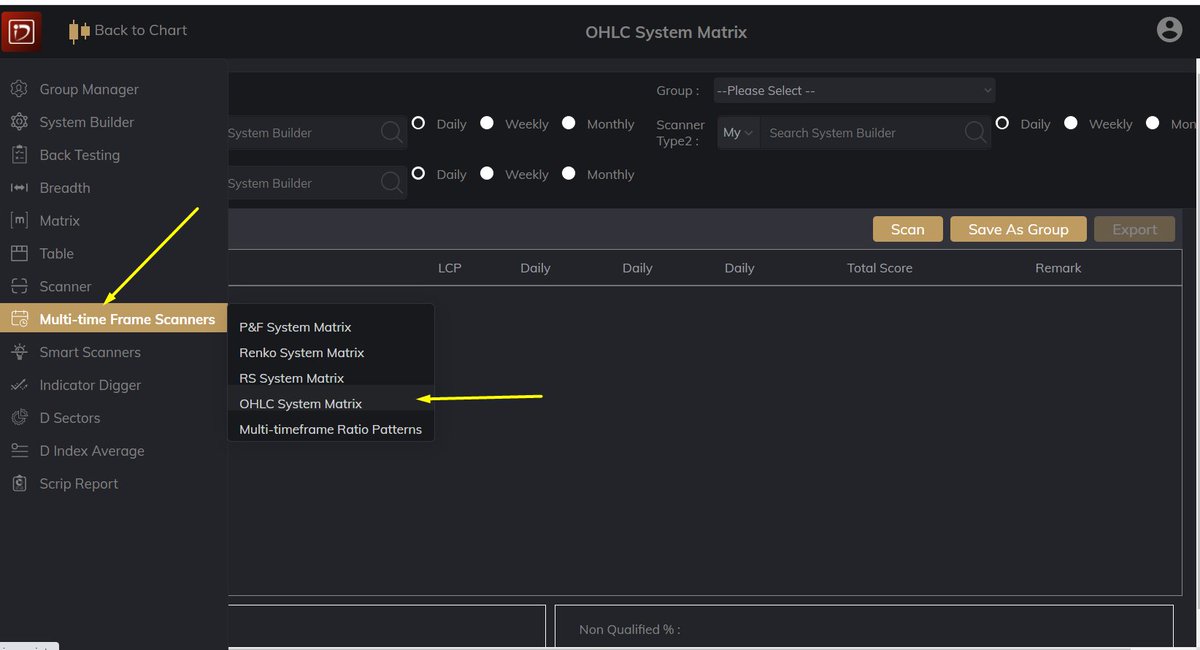
How To Create A Scan ?
Go to https://t.co/JJEJBg3Cd8 & click on 𝘊𝘳𝘦𝘢𝘵𝘦 𝘚𝘤𝘢𝘯 under 𝘚𝘤𝘳𝘦𝘦𝘯𝘦𝘳𝘴.
[3/15]
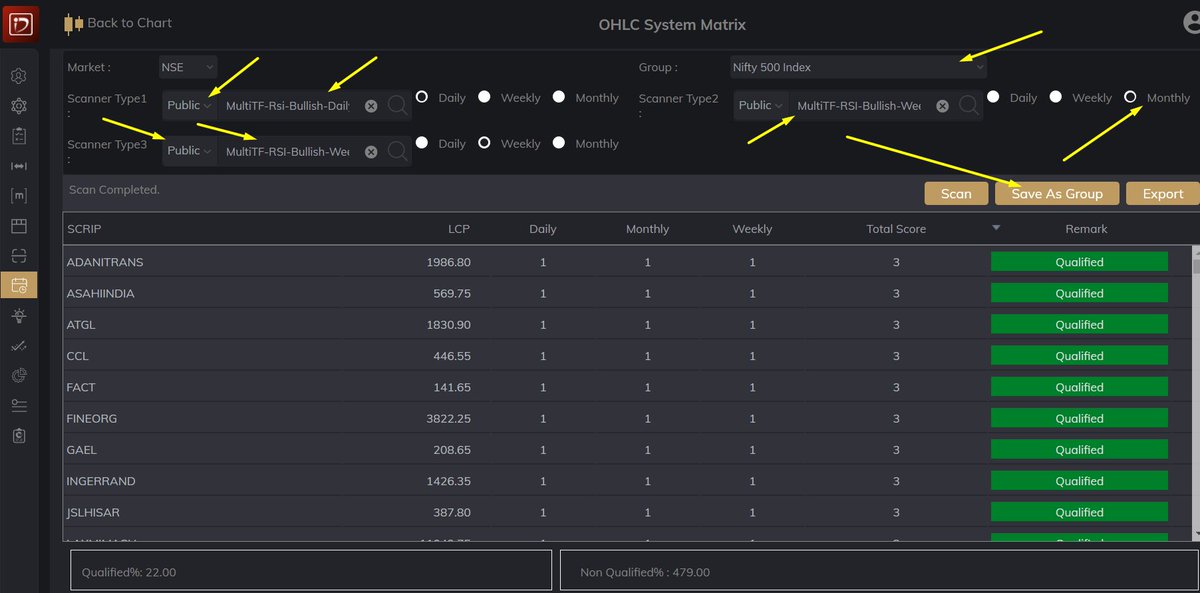
𝗙𝗶𝗿𝘀𝘁 𝗦𝘁𝗲𝗽 𝗧𝗼 𝗙𝗶𝗹𝘁𝗲𝗿 𝗦𝘁𝗼𝗰𝗸𝘀
We can select segments of stocks of our choice, e.g. cash or futures stocks, Nifty 100 etc.
Click on green ‘+’ icon to add conditions.
[4/15]

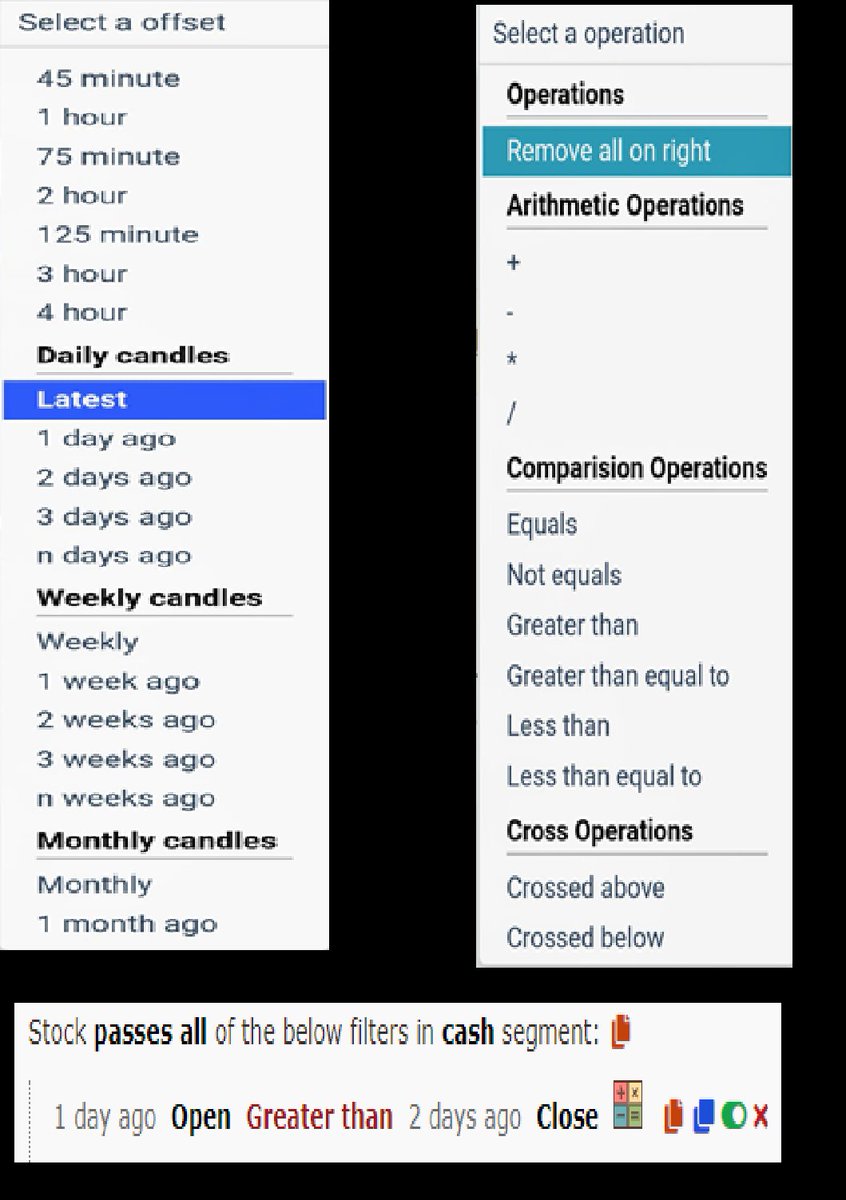
𝗖𝗮𝗻𝗱𝗹𝗲 𝗧𝗶𝗺𝗲𝗳𝗿𝗮𝗺𝗲𝘀 & 𝗖𝗼𝗺𝗽𝗮𝗿𝗶𝘀𝗼𝗻 𝗢𝗽𝗲𝗿𝗮𝘁𝗼𝗿𝘀🔸 We can select any timeframe of candles in Chartink, from minutes to years.
🔸 And compare two candles using comparison operators like 𝘌𝘲𝘶𝘢𝘭 𝘵𝘰 or 𝘎𝘳𝘦𝘢𝘵𝘦𝘳 𝘛𝘩𝘢𝘯 , crossovers etc
[5/15]
🧵 Thread 🧵
[1/15]
𝗖𝗵𝗮𝗿𝘁𝗶𝗻𝗸 𝗦𝗰𝗿𝗲𝗲𝗻𝗲𝗿 is a Stock screening tool that is useful to screen stocks based on Technical & Fundamentals.
🔸 It scans stocks by using technical indicators like RSI, MACD, divergences, etc.
🔸 It also uses fundamental tools like Book Value, EPS,PE etc
[2/15]
How To Create A Scan ?
Go to https://t.co/JJEJBg3Cd8 & click on 𝘊𝘳𝘦𝘢𝘵𝘦 𝘚𝘤𝘢𝘯 under 𝘚𝘤𝘳𝘦𝘦𝘯𝘦𝘳𝘴.
[3/15]
𝗙𝗶𝗿𝘀𝘁 𝗦𝘁𝗲𝗽 𝗧𝗼 𝗙𝗶𝗹𝘁𝗲𝗿 𝗦𝘁𝗼𝗰𝗸𝘀
We can select segments of stocks of our choice, e.g. cash or futures stocks, Nifty 100 etc.
Click on green ‘+’ icon to add conditions.
[4/15]
𝗖𝗮𝗻𝗱𝗹𝗲 𝗧𝗶𝗺𝗲𝗳𝗿𝗮𝗺𝗲𝘀 & 𝗖𝗼𝗺𝗽𝗮𝗿𝗶𝘀𝗼𝗻 𝗢𝗽𝗲𝗿𝗮𝘁𝗼𝗿𝘀🔸 We can select any timeframe of candles in Chartink, from minutes to years.
🔸 And compare two candles using comparison operators like 𝘌𝘲𝘶𝘢𝘭 𝘵𝘰 or 𝘎𝘳𝘦𝘢𝘵𝘦𝘳 𝘛𝘩𝘢𝘯 , crossovers etc
[5/15]
More from Screeners


If you’ve opened your Zerodha account recently, you may not know about some of the cool features we have across all the Zerodha products and platforms.
A thread on some features that will help you trade and invest better😀👇
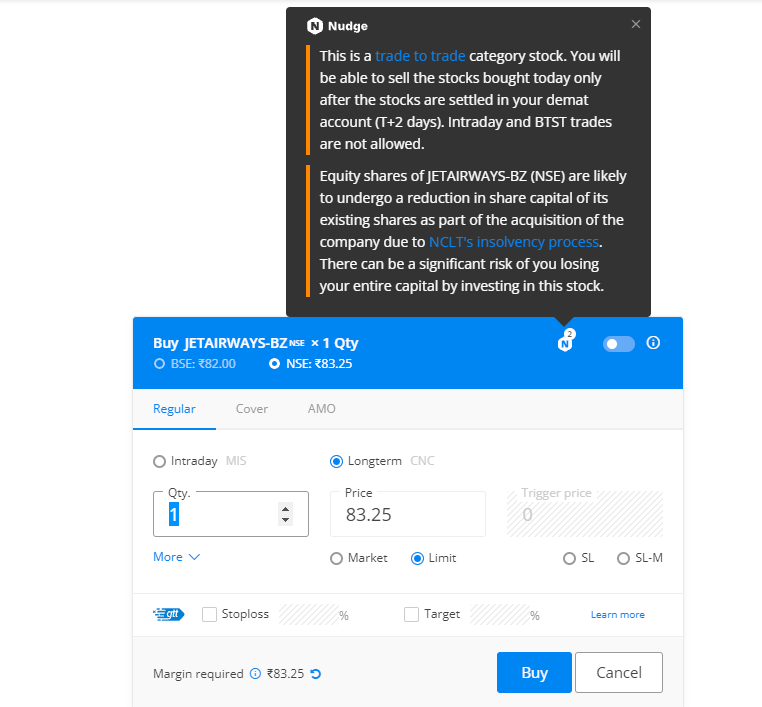
With Nudges, our aim is to help users avoid mistakes at the point of decision-making. We’ll nudge you when you’re about to make a mistake like buy dubious stocks, trade illiquid scrips, stocks with corporate actions etc. Here are a few Nudges that have helped users the most👇
With GTT, you can place long-standing orders. You can place a target and a stop loss for the stocks you buy so that you don’t have to track the prices every day. The orders will remain active until triggered*🏖
If you trade large quantities of scrips with freeze quantity, for example, you'll have to open the order window each time. With sticky order window, the order form remains open even after you place an order so that you can quickly place multiple
With the Positions Analysis tool by @BeSensibull, you can see Max loss, Max profit, Breakeven probability of profit, Greeks, IVs and much more right on Kite.
You can also change the price and expiry to see how much you'll gain or lose.
A thread on some features that will help you trade and invest better😀👇
With Nudges, our aim is to help users avoid mistakes at the point of decision-making. We’ll nudge you when you’re about to make a mistake like buy dubious stocks, trade illiquid scrips, stocks with corporate actions etc. Here are a few Nudges that have helped users the most👇
With GTT, you can place long-standing orders. You can place a target and a stop loss for the stocks you buy so that you don’t have to track the prices every day. The orders will remain active until triggered*🏖
If you trade large quantities of scrips with freeze quantity, for example, you'll have to open the order window each time. With sticky order window, the order form remains open even after you place an order so that you can quickly place multiple
Normally after you place an order, the order window closes. With the Sticky order window, the order window remains open, making it easy to place multiple orders with the same input with just one click\u26a1rather than doing it all over again. This helps overcome qty freeze limits. pic.twitter.com/65kXY4h9f0
— Zerodha (@zerodhaonline) November 15, 2021
With the Positions Analysis tool by @BeSensibull, you can see Max loss, Max profit, Breakeven probability of profit, Greeks, IVs and much more right on Kite.
You can also change the price and expiry to see how much you'll gain or lose.


You May Also Like


THREAD PART 1.
On Sunday 21st June, 14 year old Noah Donohoe left his home to meet his friends at Cave Hill Belfast to study for school. #RememberMyNoah💙

He was on his black Apollo mountain bike, fully dressed, wearing a helmet and carrying a backpack containing his laptop and 2 books with his name on them. He also had his mobile phone with him.
On the 27th of June. Noah's naked body was sadly discovered 950m inside a storm drain, between access points. This storm drain was accessible through an area completely unfamiliar to him, behind houses at Northwood Road. https://t.co/bpz3Rmc0wq
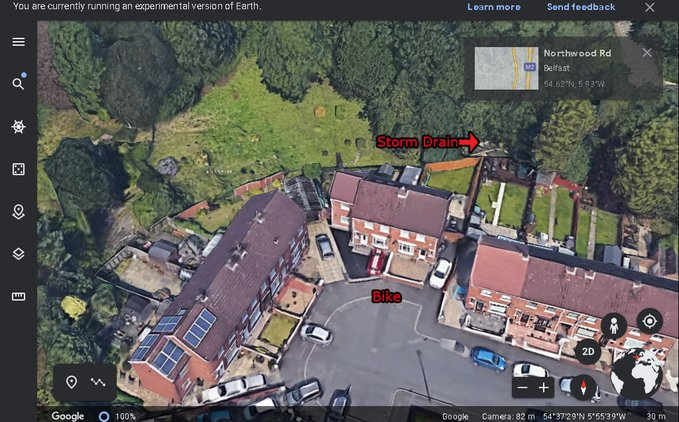
"Noah's body was found by specially trained police officers between two drain access points within a section of the tunnel running under the Translink access road," said Mr McCrisken."
Noah's bike was also found near a house, behind a car, in the same area. It had been there for more than 24 hours before a member of public who lived in the street said she read reports of a missing child and checked the bike and phoned the police.
On Sunday 21st June, 14 year old Noah Donohoe left his home to meet his friends at Cave Hill Belfast to study for school. #RememberMyNoah💙
He was on his black Apollo mountain bike, fully dressed, wearing a helmet and carrying a backpack containing his laptop and 2 books with his name on them. He also had his mobile phone with him.
On the 27th of June. Noah's naked body was sadly discovered 950m inside a storm drain, between access points. This storm drain was accessible through an area completely unfamiliar to him, behind houses at Northwood Road. https://t.co/bpz3Rmc0wq
"Noah's body was found by specially trained police officers between two drain access points within a section of the tunnel running under the Translink access road," said Mr McCrisken."
Noah's bike was also found near a house, behind a car, in the same area. It had been there for more than 24 hours before a member of public who lived in the street said she read reports of a missing child and checked the bike and phoned the police.