
In this session we talked about
1. Basics of Option Selling
2. Directional Vs Non Directional
3. Straddle and Strangle Backtest
4. Benefits of Automated
More from JayneshKasliwal


𝗛𝗼𝘄 𝘁𝗼 𝗰𝗿𝗲𝗮𝘁𝗲 𝘆𝗼𝘂𝗿 𝗼𝘄𝗻 𝗖𝗵𝗮𝗿𝘁𝗶𝗻𝗸 𝗦𝗰𝗿𝗲𝗲𝗻𝗲𝗿
🧵 Thread 🧵
[1/15]
𝗖𝗵𝗮𝗿𝘁𝗶𝗻𝗸 𝗦𝗰𝗿𝗲𝗲𝗻𝗲𝗿 is a Stock screening tool that is useful to screen stocks based on Technical & Fundamentals.
🔸 It scans stocks by using technical indicators like RSI, MACD, divergences, etc.
🔸 It also uses fundamental tools like Book Value, EPS,PE etc
[2/15]
How To Create A Scan ?
Go to https://t.co/nQ7t44bt9T & click on 𝘊𝘳𝘦𝘢𝘵𝘦 𝘚𝘤𝘢𝘯 under 𝘚𝘤𝘳𝘦𝘦𝘯𝘦𝘳𝘴.
[3/15]
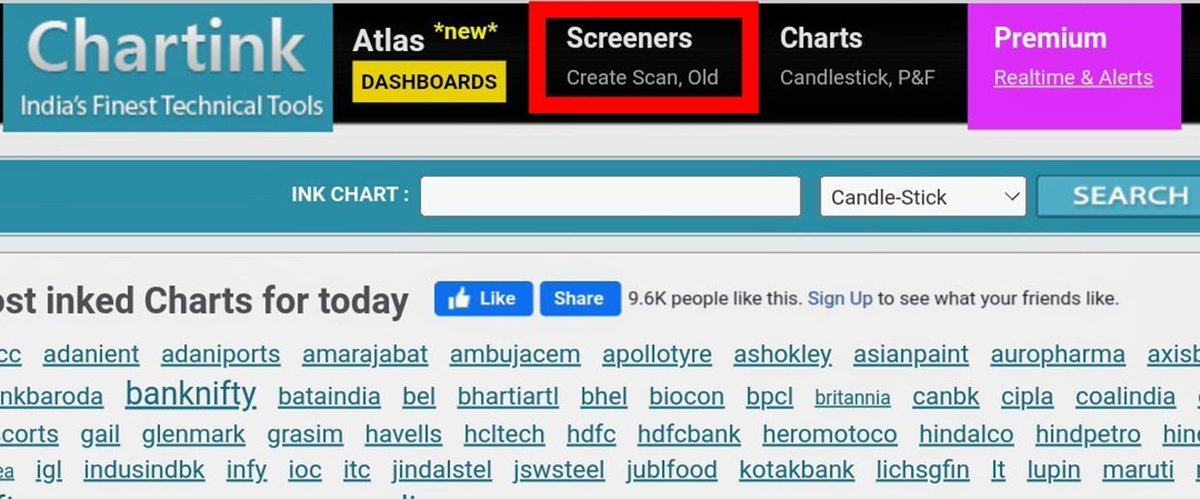
𝗙𝗶𝗿𝘀𝘁 𝗦𝘁𝗲𝗽 𝗧𝗼 𝗙𝗶𝗹𝘁𝗲𝗿 𝗦𝘁𝗼𝗰𝗸𝘀
We can select segments of stocks of our choice, e.g. cash or futures stocks, Nifty 100 etc.
Click on green ‘+’ icon to add conditions.
[4/15]

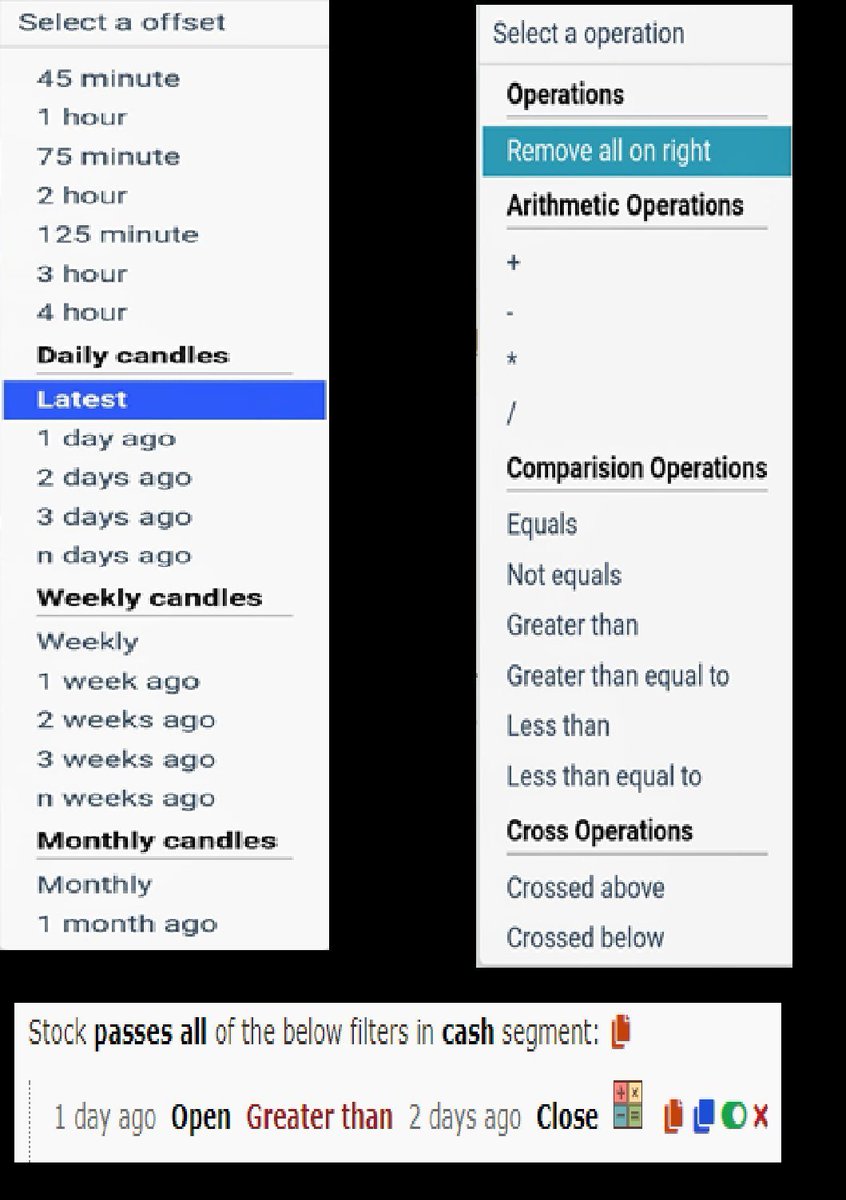
𝗖𝗮𝗻𝗱𝗹𝗲 𝗧𝗶𝗺𝗲𝗳𝗿𝗮𝗺𝗲𝘀 & 𝗖𝗼𝗺𝗽𝗮𝗿𝗶𝘀𝗼𝗻 𝗢𝗽𝗲𝗿𝗮𝘁𝗼𝗿𝘀
🔸 We can select any timeframe of candles in Chartink, from minutes to years.
🔸 And compare two candles using comparison operators like 𝘌𝘲𝘶𝘢𝘭 𝘵𝘰 or 𝘎𝘳𝘦𝘢𝘵𝘦𝘳 𝘛𝘩𝘢𝘯 , crossovers etc
[5/15]
🧵 Thread 🧵
[1/15]
𝗖𝗵𝗮𝗿𝘁𝗶𝗻𝗸 𝗦𝗰𝗿𝗲𝗲𝗻𝗲𝗿 is a Stock screening tool that is useful to screen stocks based on Technical & Fundamentals.
🔸 It scans stocks by using technical indicators like RSI, MACD, divergences, etc.
🔸 It also uses fundamental tools like Book Value, EPS,PE etc
[2/15]
How To Create A Scan ?
Go to https://t.co/nQ7t44bt9T & click on 𝘊𝘳𝘦𝘢𝘵𝘦 𝘚𝘤𝘢𝘯 under 𝘚𝘤𝘳𝘦𝘦𝘯𝘦𝘳𝘴.
[3/15]
𝗙𝗶𝗿𝘀𝘁 𝗦𝘁𝗲𝗽 𝗧𝗼 𝗙𝗶𝗹𝘁𝗲𝗿 𝗦𝘁𝗼𝗰𝗸𝘀
We can select segments of stocks of our choice, e.g. cash or futures stocks, Nifty 100 etc.
Click on green ‘+’ icon to add conditions.
[4/15]
𝗖𝗮𝗻𝗱𝗹𝗲 𝗧𝗶𝗺𝗲𝗳𝗿𝗮𝗺𝗲𝘀 & 𝗖𝗼𝗺𝗽𝗮𝗿𝗶𝘀𝗼𝗻 𝗢𝗽𝗲𝗿𝗮𝘁𝗼𝗿𝘀
🔸 We can select any timeframe of candles in Chartink, from minutes to years.
🔸 And compare two candles using comparison operators like 𝘌𝘲𝘶𝘢𝘭 𝘵𝘰 or 𝘎𝘳𝘦𝘢𝘵𝘦𝘳 𝘛𝘩𝘢𝘯 , crossovers etc
[5/15]


More from Optionslearnings

#Learning Those who are interested in options... Here is an old tweet on gamma scalping ...
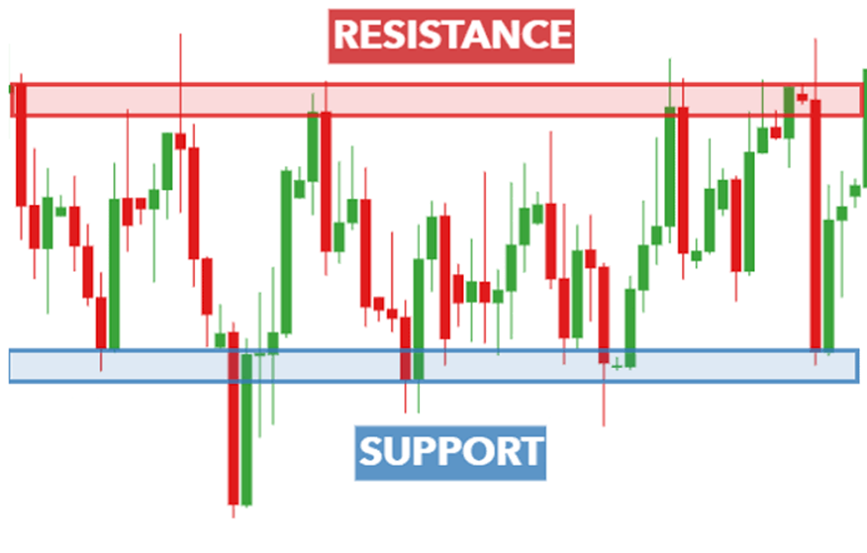
#Straddle #Gammascalping #Learning Success In option writing can be achieved only by adjustments based on the market developments. The same goes with straddle strategy as well. A method called gamma scalping helps to minimize potential loss in straddles. pic.twitter.com/qgSmgd8RWM
— HMK alias MANOJ (@scorpiomanojFRM) June 19, 2020


You May Also Like

BREAKING: @CommonsCMS @DamianCollins just released previously sealed #Six4Three @Facebook documents:
Some random interesting tidbits:
1) Zuck approves shutting down platform API access for Twitter's when Vine is released #competition
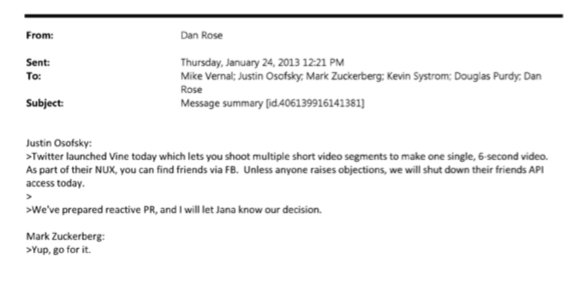
2) Facebook engineered ways to access user's call history w/o alerting users:
Team considered access to call history considered 'high PR risk' but 'growth team will charge ahead'. @Facebook created upgrade path to access data w/o subjecting users to Android permissions dialogue.
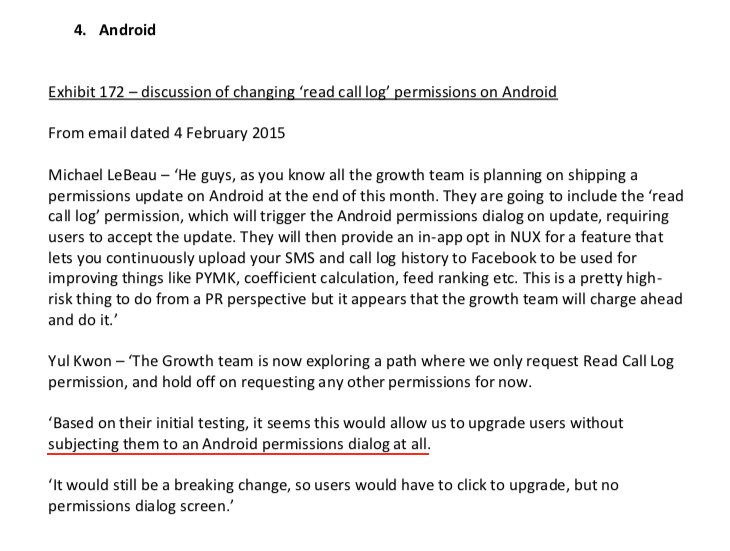
3) The above also confirms @kashhill and other's suspicion that call history was used to improve PYMK (People You May Know) suggestions and newsfeed rankings.
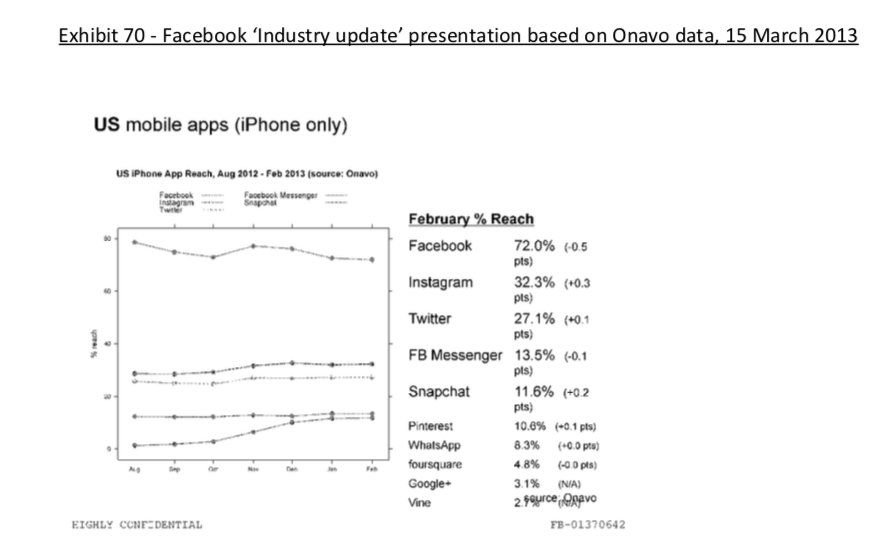
4) Docs also shed more light into @dseetharaman's story on @Facebook monitoring users' @Onavo VPN activity to determine what competitors to mimic or acquire in 2013.
https://t.co/PwiRIL3v9x
Some random interesting tidbits:
1) Zuck approves shutting down platform API access for Twitter's when Vine is released #competition
2) Facebook engineered ways to access user's call history w/o alerting users:
Team considered access to call history considered 'high PR risk' but 'growth team will charge ahead'. @Facebook created upgrade path to access data w/o subjecting users to Android permissions dialogue.
3) The above also confirms @kashhill and other's suspicion that call history was used to improve PYMK (People You May Know) suggestions and newsfeed rankings.
4) Docs also shed more light into @dseetharaman's story on @Facebook monitoring users' @Onavo VPN activity to determine what competitors to mimic or acquire in 2013.
https://t.co/PwiRIL3v9x


Krugman is, of course, right about this. BUT, note that universities can do a lot to revitalize declining and rural regions.
See this thing that @lymanstoneky wrote:
And see this thing that I wrote:
And see this book that @JamesFallows wrote:
And see this other thing that I wrote:
One thing I've been noticing about responses to today's column is that many people still don't get how strong the forces behind regional divergence are, and how hard to reverse 1/ https://t.co/Ft2aH1NcQt
— Paul Krugman (@paulkrugman) November 20, 2018
See this thing that @lymanstoneky wrote:
And see this thing that I wrote:
And see this book that @JamesFallows wrote:
And see this other thing that I wrote: