Technical Analysis Masterclass- Part 2
'Entering the trade'
Entering a trade without ascertaining a certain things is gambling.
In this masterclass we will learn the pre-requisites to enter a trade.
DON'T ENTER A TRADE WITHOUT DETERMINNG THE FOLLOWING.
Please share.
We understand what reward to risk (popularly called risk to reward) is.
It will be denoted by R:R.
We will also try to bust a few myths about R:R and how to avoid losing trades.
Before entering a trade, you need to determine 3 things.
1. Entry trigger
2. Stop loss
3. Target
1. Entry trigger = Reasons for entering a trade. There could be multiple reasons or a single reason for entry.
Generally a set of reasons AKA confluence is a higher probability trade and a generally a safer entry.
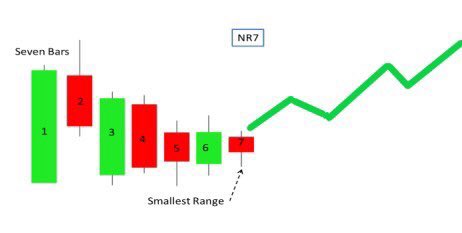
Example of an entry trigger.
2. Stop Loss.
The price in the opposite direction of the trade where the trade is exited, at a loss.
At this level, the reason for the entry becomes invalidated according to TA and the price can then move in the opposite direction, probabilistically.
3. Target is the possible price level that the asset might touch based on previous trends or confluence AND where a possible reversal could occur.
Target is the next path of least resistance from where the price might reverse.
We will always ONLY use TA to determine all 3.