Print this and paste it on your #trading desk ⚡️
Your mini TA book.

More from The Chartians
And Edge comes with Data and Resources.
But 90% of Retail don’t have access to authentic educational data.
This compilation is surely a 50,000₹ Technical Analysis’s course in itself 🧵
https://t.co/PTeE1Hms9Y
Trading on chart patterns is difficult, Until you see this:
— The Chartians (@chartians) August 6, 2022
Free Technical Analysis course (1/10) \U0001f9f5
https://t.co/2JvDpSzHds
Trading on chart patterns is difficult, Until you read this ! \u26a1\ufe0f
— The Chartians (@chartians) August 21, 2022
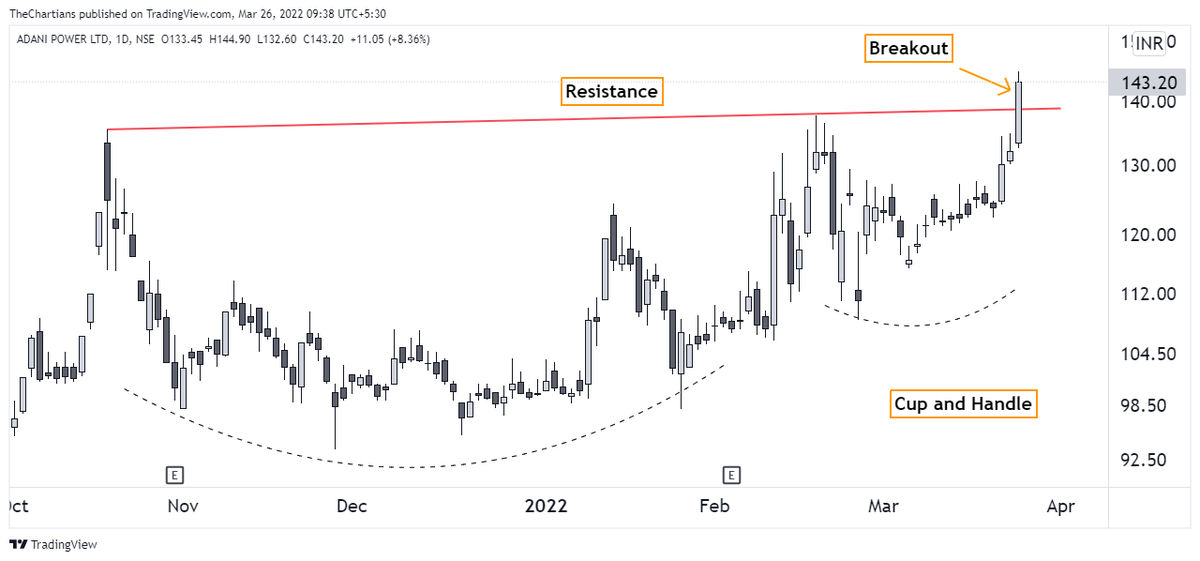
Everything about Cup and Handle Pattern
Free Technical Analysis course (2/10) \U0001f9f5
https://t.co/QuX8o1MUbo
Trading on chart patterns is difficult until you read this !\u26a1\ufe0f
— The Chartians (@chartians) August 28, 2022
Everything about Ascending Triangle Pattern
Free Technical Analysis course (3/10) \U0001f9f5
https://t.co/5dBdHq9CBY
Trading on chart patterns is difficult, Until you read this ! \u26a1\ufe0f
— The Chartians (@chartians) October 9, 2022
Everything about Head and Shoulder Pattern
Free Technical Analysis course (4/10) \U0001f9f5
Here is the
Glad that many could guess/ know the candle stick pattern and mainly know how to use it.
— The Chartians (@chartians) July 24, 2021
The one shown in the image was bullish Harami
The word Harami comes from an old Japanese word meaning pregnant.. pic.twitter.com/4qBDCyY2Pq
More from Screeners


You May Also Like


This New York Times feature shows China with a Gini Index of less than 30, which would make it more equal than Canada, France, or the Netherlands. https://t.co/g3Sv6DZTDE
That's weird. Income inequality in China is legendary.
Let's check this number.
2/The New York Times cites the World Bank's recent report, "Fair Progress? Economic Mobility across Generations Around the World".
The report is available here:
3/The World Bank report has a graph in which it appears to show the same value for China's Gini - under 0.3.
The graph cites the World Development Indicators as its source for the income inequality data.

4/The World Development Indicators are available at the World Bank's website.
Here's the Gini index: https://t.co/MvylQzpX6A
It looks as if the latest estimate for China's Gini is 42.2.
That estimate is from 2012.
5/A Gini of 42.2 would put China in the same neighborhood as the U.S., whose Gini was estimated at 41 in 2013.
I can't find the <30 number anywhere. The only other estimate in the tables for China is from 2008, when it was estimated at 42.8.

1. LWJ’s sword Bichen ‘is likely an abbreviation for the term 躲避红尘 (duǒ bì hóng chén), which can be translated as such: 躲避: shunning or hiding away from 红尘 (worldly affairs; which is a buddhist teaching.) (https://t.co/zF65W3roJe) (abbrev. TWX)
2. Sandu (三 毒), Jiang Cheng’s sword, refers to the three poisons (triviṣa) in Buddhism; desire (kāma-taṇhā), delusion (bhava-taṇhā) and hatred (vibhava-taṇhā).
These 3 poisons represent the roots of craving (tanha) and are the cause of Dukkha (suffering, pain) and thus result in rebirth.
Interesting that MXTX used this name for one of the characters who suffers, arguably, the worst of these three emotions.
3. The Qian kun purse “乾坤袋 (qián kūn dài) – can be called “Heaven and Earth” Pouch. In Buddhism, Maitreya (मैत्रेय) owns this to store items. It was believed that there was a mythical space inside the bag that could absorb the world.” (TWX)