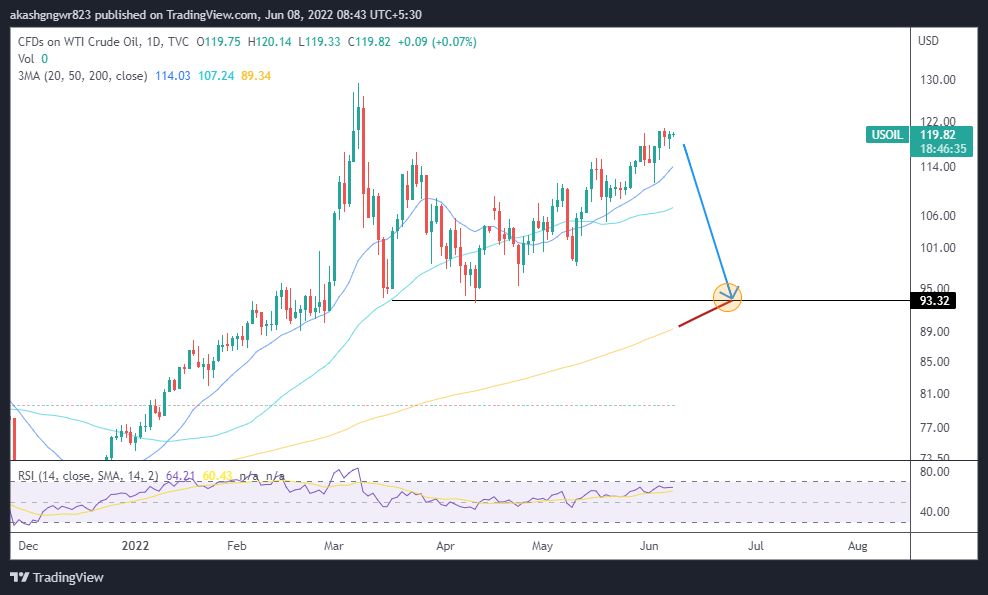
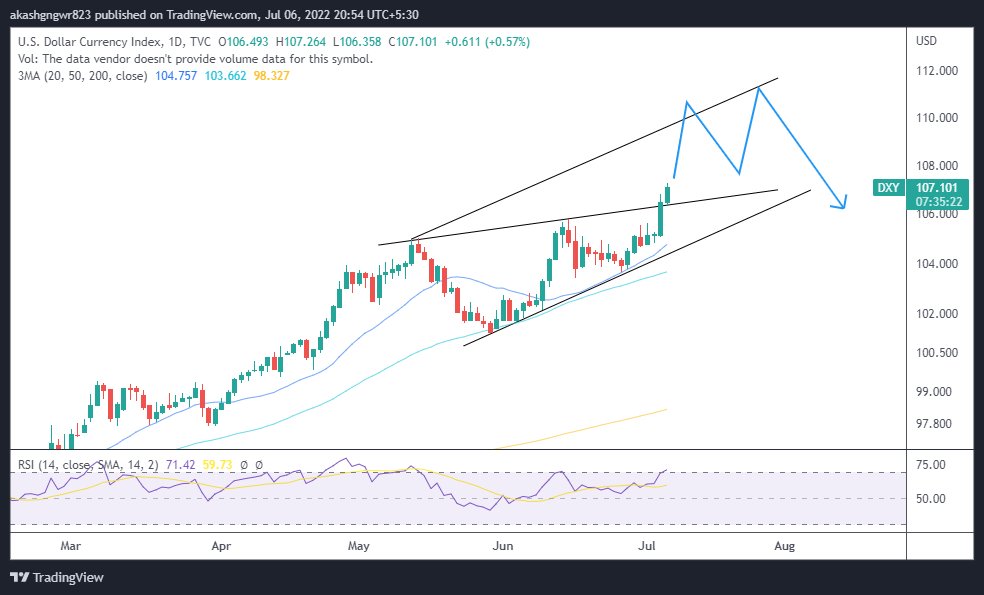
A rising wedge when broken decisively on the upside turns into a channel and stretches a little on the top of channel after a non stop move. Expecting this trajectory as of now.
#DXY
More from Aakash Gangwar
To chaiye chalte h 12K ki taraf.
#BTC https://t.co/Yd4iZqC42s
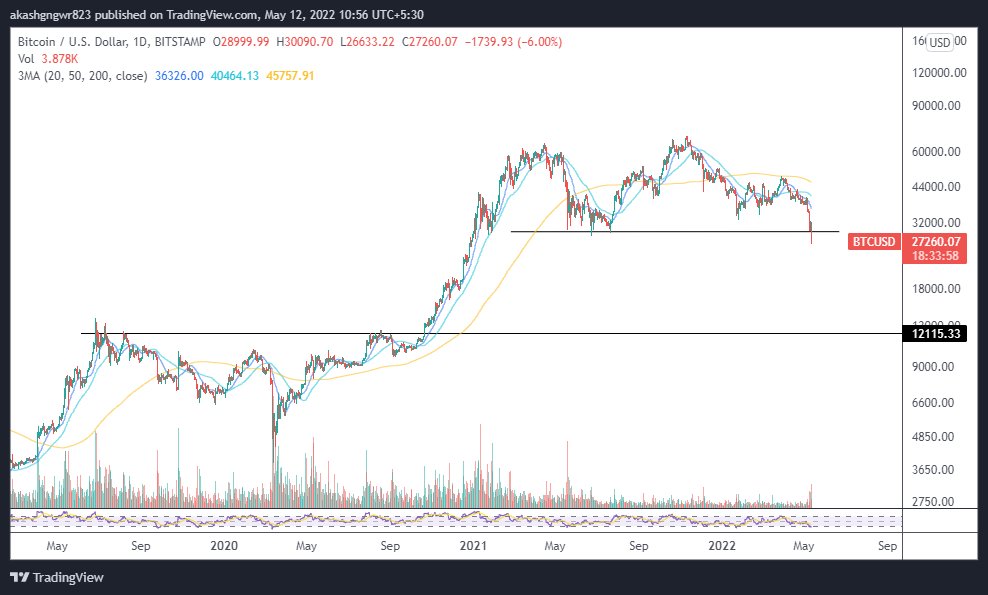
#BTC https://t.co/Yd4iZqC42s
I don't know why Crypto YouTubers are so bullish on BTC right from the top \U0001f61b while the charts are saying something else. Won't be surprised to see the entire retracement of the marked rise. #BTC pic.twitter.com/SQJkjAfZme
— Aakash Gangwar (@akashgngwr823) April 30, 2022
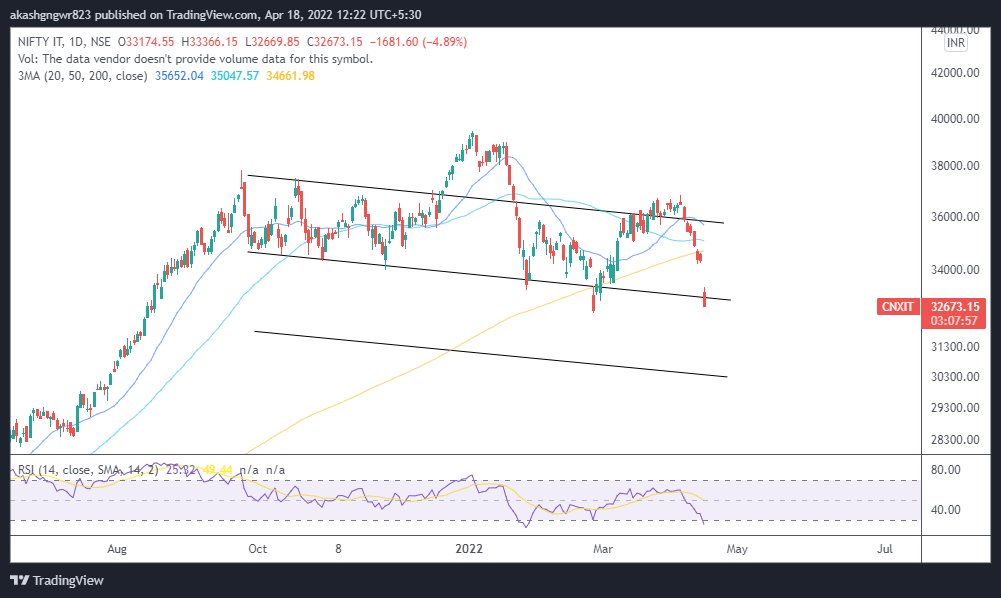
Parabolic move has been triggered. Let's have 27k. That could be the buying zone for IT names.
#CNXIT https://t.co/bJeKTMoCji
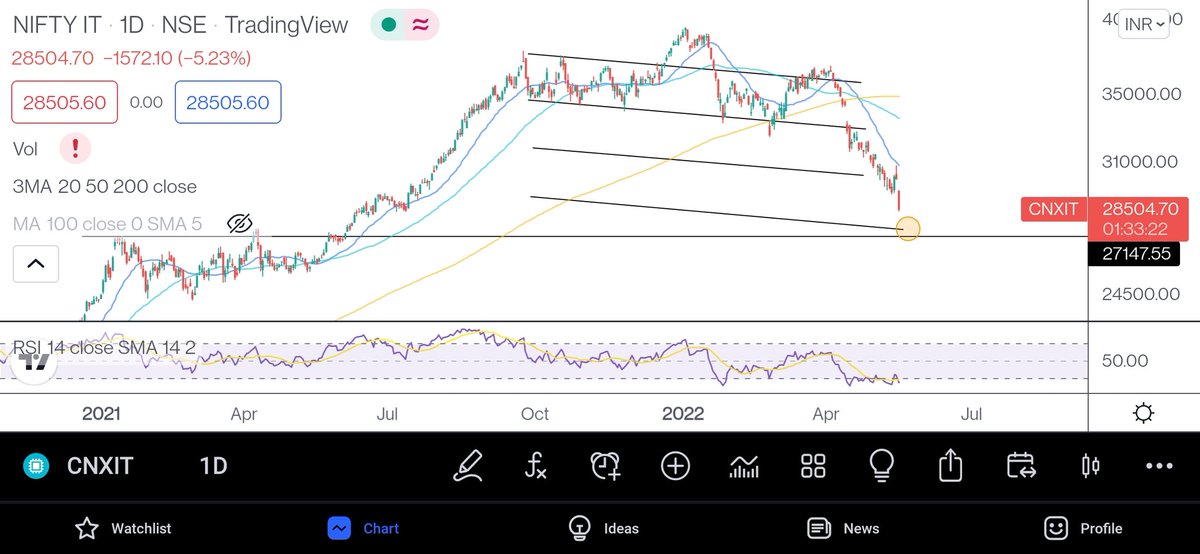
#CNXIT https://t.co/bJeKTMoCji
The current formation might look like a falling wedge, but the way moving averages are placed, it looks like a falling wedge which can lead to a parabolic downmove for the marked target. #CNXIT pic.twitter.com/GmXOI3HmUN
— Aakash Gangwar (@akashgngwr823) May 10, 2022