What is Inside Bar ?
A thread 🔖 on IB candlestick and its strategy !
Retweet And Share 🔄
@Techno_Charts @JayneshKasliwal
#StockMarket
1/n
What is the Inside Bar Pattern?
The inside bar pattern is a one candlestick pattern where price forms completely within the previous candlestick.
For an IB to be considered valid both the high and the low of the
candlestick or need to be completely inside the previous candle
2/n
There is often confusion around the wicks or shadows of the candlesticks
NOTE : the inside bar takes into account the candlestick wicks.
This means that the high and low, including the wicks of the candle must be within the high and low of the previous candlestick.
3/n
Is the Inside Bar Bullish or Bearish?
The inside bar is an indecision candlestick pattern.
The inside bar is formed because price was not able to break either the high or the
low of the previous session. .
4/n
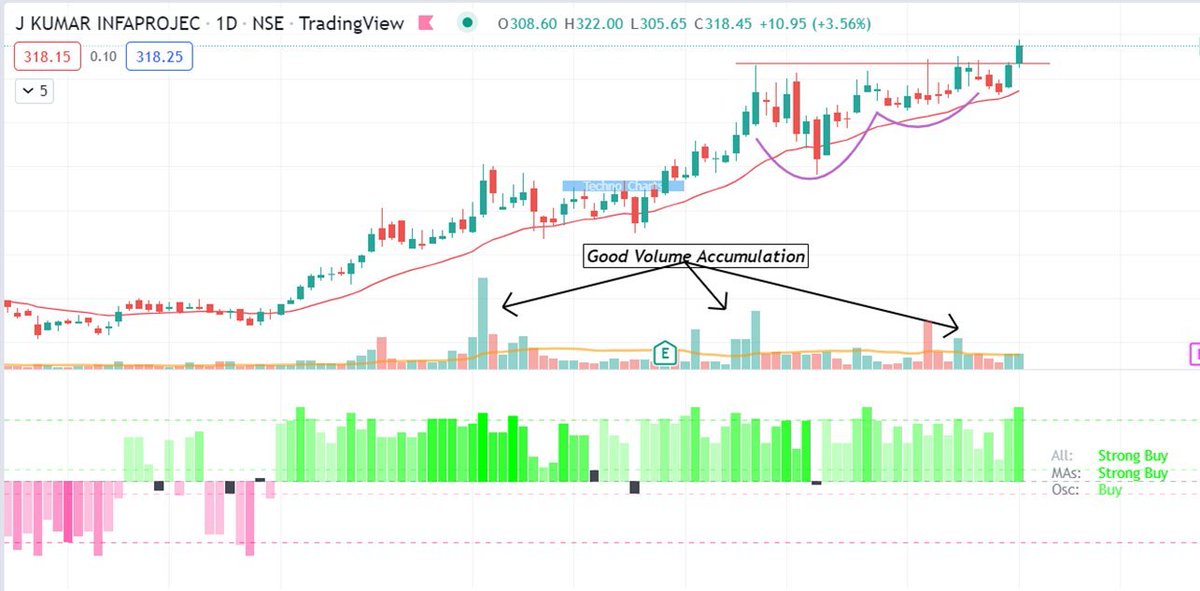
A trend continuation pattern
1. If an inside bar forms in a strong trend, for example a trend higher, then it could be signalling a quick pause before price continues on with the trend.
2. It simply means some Volatilty contraction and hence price moving in small range .
5/n