Authors Arpan K.
7 days
30 days
All time
Recent
Popular

Many people ask me about Relative Strength (RS) line on my chart, and its utility. So, finally I've published a script on TradingView which lets you add this indicator to your chart!
𝗥𝗲𝗹𝗮𝘁𝗶𝘃𝗲 𝗦𝘁𝗿𝗲𝗻𝗴𝘁𝗵 𝗟𝗶𝗻𝗲 𝗯𝘆 @𝗶𝗔𝗿𝗽𝗮𝗻𝗞 v1.0
Read full thread for steps
Step #1
Head to the indicators tab on top of your TradingView chart and search for the indicator name or my id - 𝗶𝗔𝗿𝗽𝗮𝗻𝗞
You'll find my indicator there.
Step #2
Click on 'Add to favorites' as shown in image below

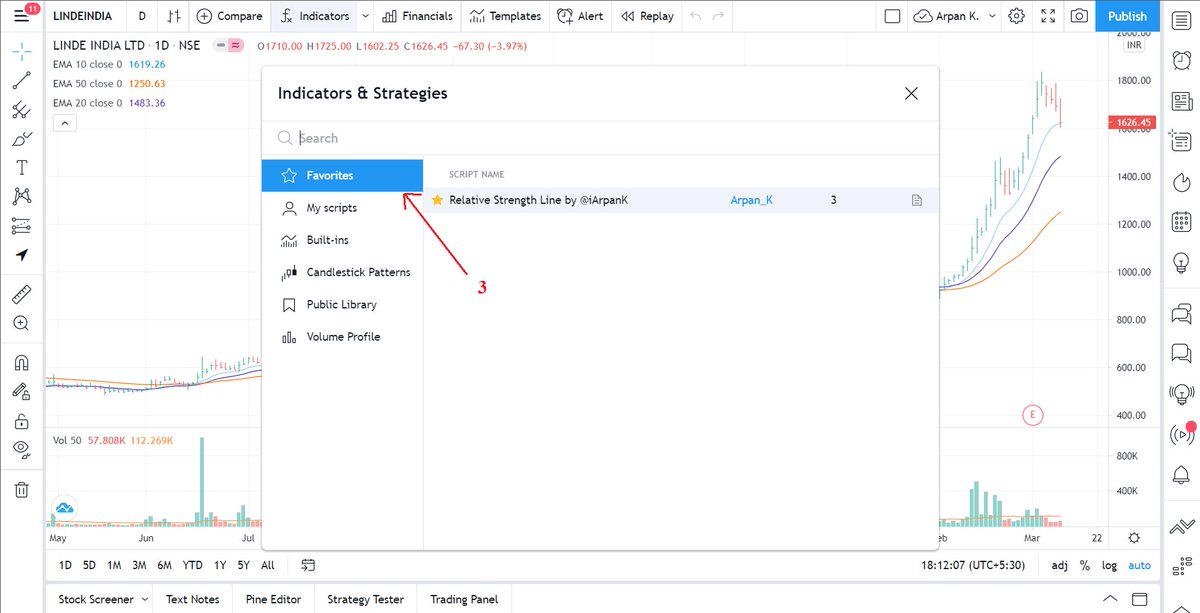
Step #3
Go to the 'Favorites' section in the same dialog box, as shown in image below.
You'll find the indicator there. Now click on it and it gets added to your chart! Now you can access this indicator anytime from Indicators -> Favorites.
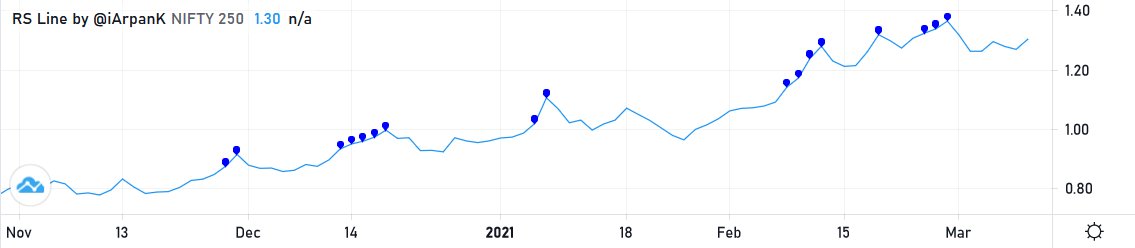
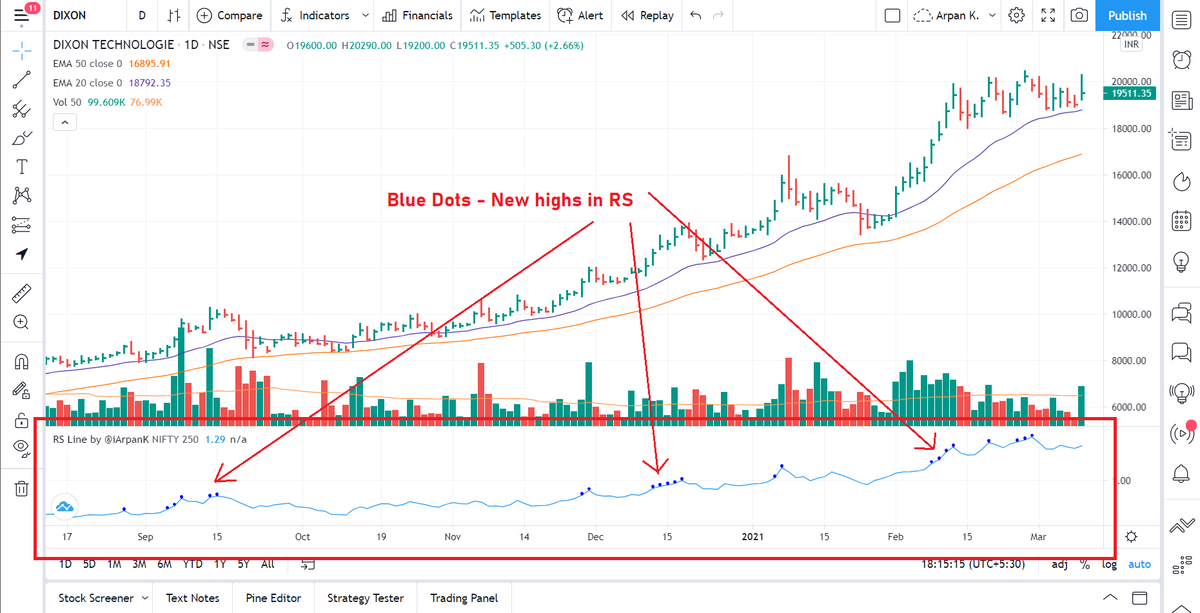
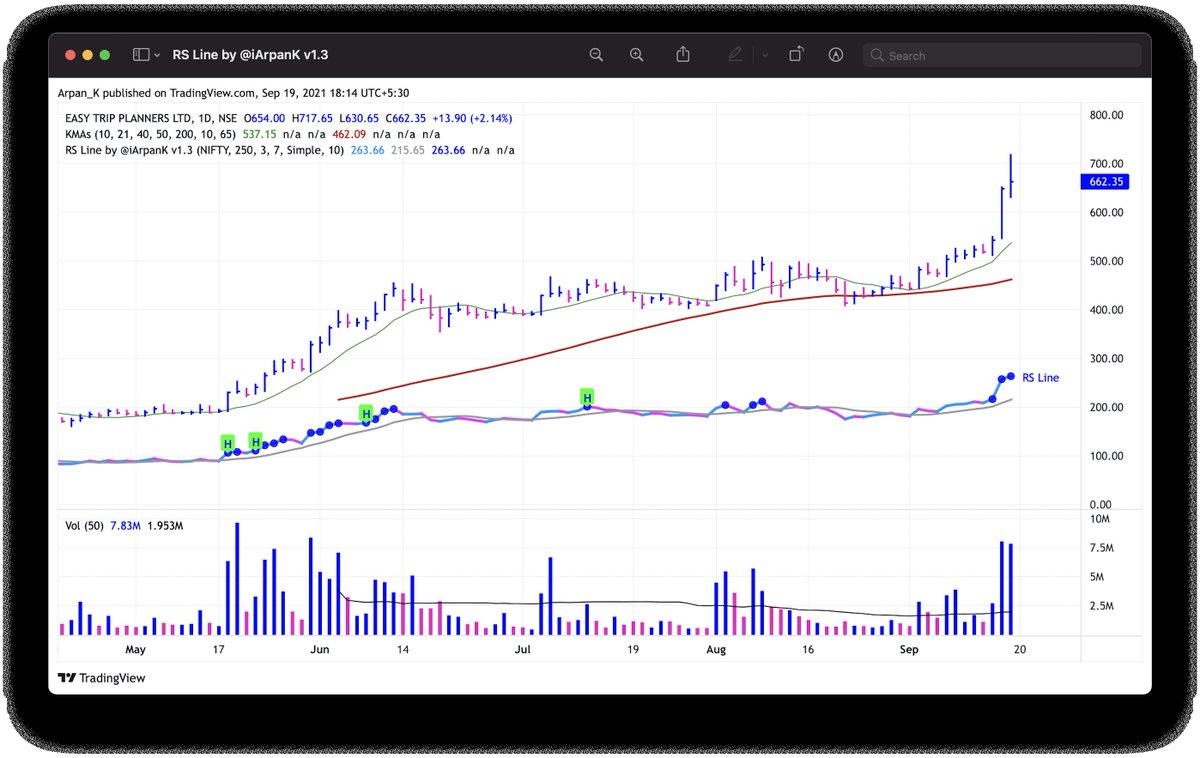
Finally, we have the RS line indicator on the bottom of the chart with blue dots denoting new highs in RS!
By default, blue dots show new 250 days high in RS (~1 year high)
But you can change the indicator period, colors, symbols by heading to the settings tab of the indicator.
You can check the full documentation of the script with complete user settings & usage details on https://t.co/3q9UOn5GF7
Use it in your day-to-day trading & let me know your experience :)
𝗥𝗲𝗹𝗮𝘁𝗶𝘃𝗲 𝗦𝘁𝗿𝗲𝗻𝗴𝘁𝗵 𝗟𝗶𝗻𝗲 𝗯𝘆 @𝗶𝗔𝗿𝗽𝗮𝗻𝗞 v1.0
Read full thread for steps
Step #1
Head to the indicators tab on top of your TradingView chart and search for the indicator name or my id - 𝗶𝗔𝗿𝗽𝗮𝗻𝗞
You'll find my indicator there.
Step #2
Click on 'Add to favorites' as shown in image below
Step #3
Go to the 'Favorites' section in the same dialog box, as shown in image below.
You'll find the indicator there. Now click on it and it gets added to your chart! Now you can access this indicator anytime from Indicators -> Favorites.
Finally, we have the RS line indicator on the bottom of the chart with blue dots denoting new highs in RS!
By default, blue dots show new 250 days high in RS (~1 year high)
But you can change the indicator period, colors, symbols by heading to the settings tab of the indicator.
You can check the full documentation of the script with complete user settings & usage details on https://t.co/3q9UOn5GF7
Use it in your day-to-day trading & let me know your experience :)
Relative Strength Line by @iArpanK v1.3
https://t.co/3q9UOn5GF7
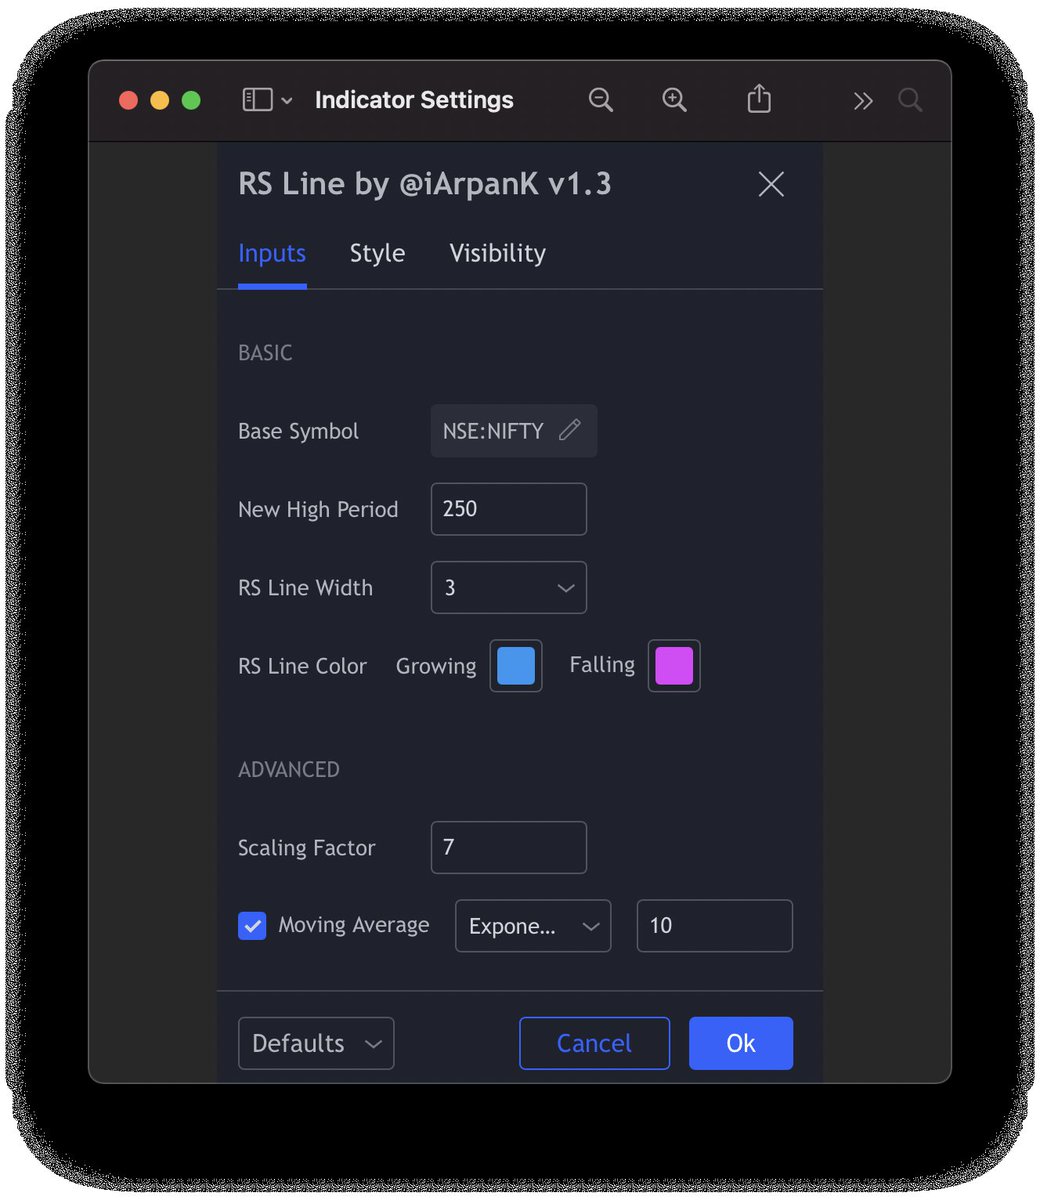
This update enables adding a Moving Average to the indicator, as requested by several users.
Indicator settings (ADVANCED section)
- Toggle moving average on/off using the checkbox
- Change indicator type (Simple/Exponential/Weighted)
- Change indicator period
Project (now open source) : https://t.co/xHpPUU4ZdN
Change indicator pane : https://t.co/u0BqraiFce
All users are requested to remove and add the indicator again to their chart, in order to utilise the new v1.3.
Thanks!
https://t.co/3q9UOn5GF7
This update enables adding a Moving Average to the indicator, as requested by several users.
Indicator settings (ADVANCED section)
- Toggle moving average on/off using the checkbox
- Change indicator type (Simple/Exponential/Weighted)
- Change indicator period
Project (now open source) : https://t.co/xHpPUU4ZdN
Change indicator pane : https://t.co/u0BqraiFce
All users are requested to remove and add the indicator again to their chart, in order to utilise the new v1.3.
Thanks!