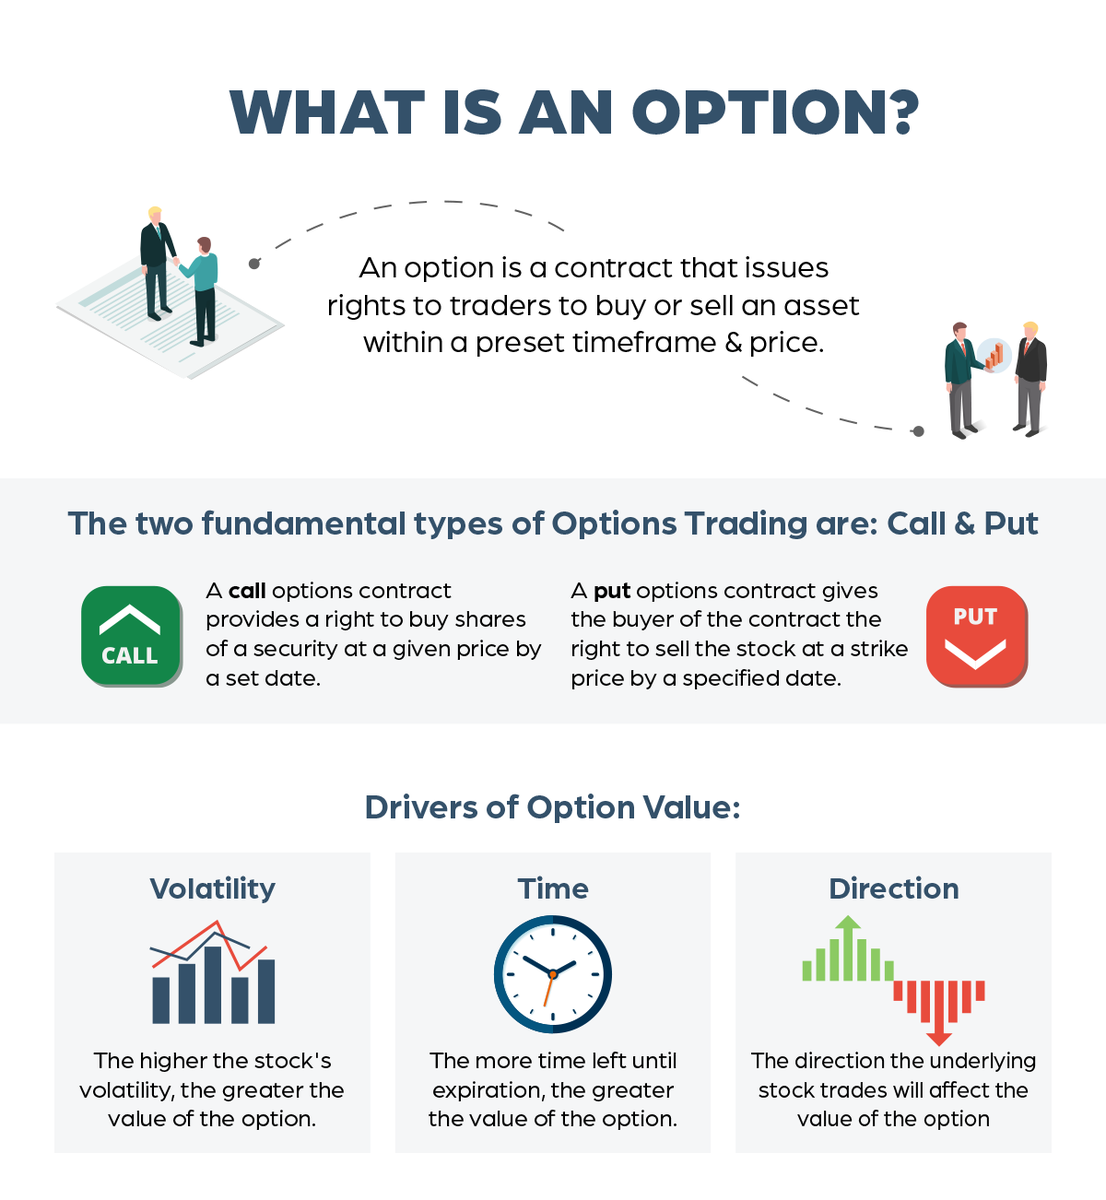
OI Data reading seekh lo:
See Large OIl buildup kin strikes par hai and in between strikes data kaise move ho raha hai.
Thumb Rule:
Calls Reduction + Puts addition = Upthrust
Calls Addition + Put Reduction = Down move
Higher the Delta OI velocity, faster is the move.
For Nifty Intraday Traders: As of now, this seems to be a buy on dip market and looks like there won't be any juicy trades on short side. Will update if data changes. https://t.co/PCIyyPld4A pic.twitter.com/ES3o4z60rY
— Professor (@DillikiBiili) March 11, 2022
More from Professor
It has string resistance at 3200, so fresh up-move will be confirmed only when it opens above 3220-3230 levels
#ASIANPAINT
#DKBPositional https://t.co/Q6fTbK5VHM
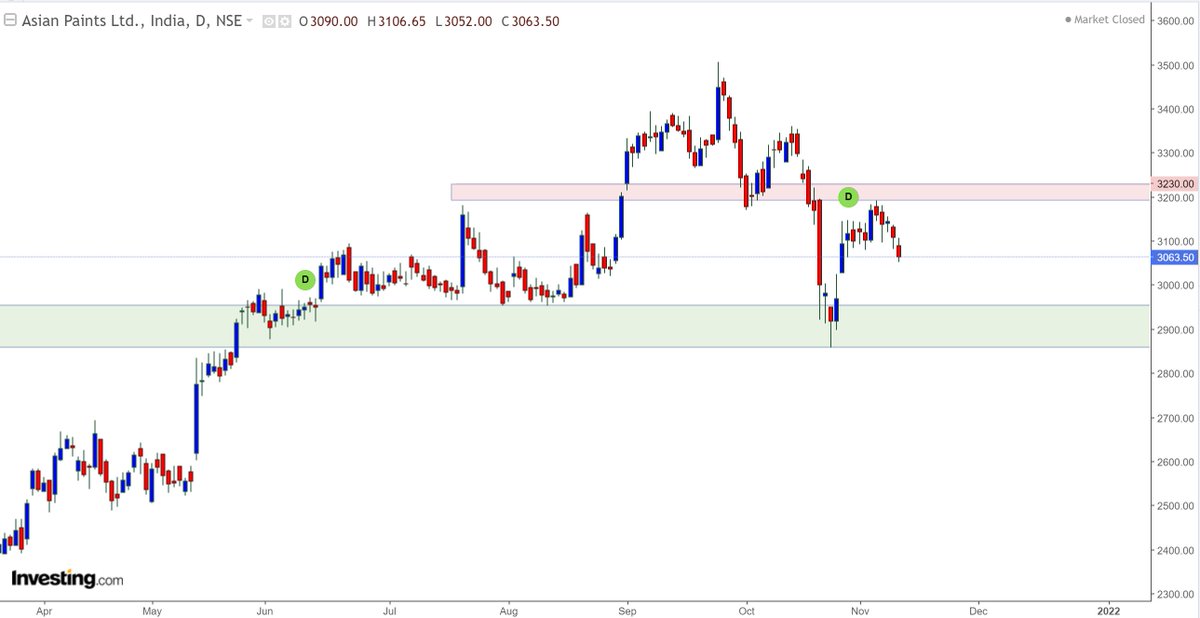
Asian Paints also at crucial support line, bulls desperately need a reversal here, else it'll go in hibernation..... pic.twitter.com/VTfaMfpHXs
— Professor (@DillikiBiili) October 21, 2021
One Chadarmod on timeline posted that I’m giving gyan without having experience or expertise.
So I’ll begin with paying my portfolio performance tribute to these charlies.
https://t.co/GNM5SsNFNo
Sadda Haqq ! Aithe Rakhh......... pic.twitter.com/IH5q3v2gw9
— Professor (@DillikiBiili) October 5, 2021
Fundamentals based investing can generate serious wealth as the most famous (rather infamous) Warren Buffett has shown.
In India also we have many success stories like @VijayKedia1 @Raamdeo R K Damani Rakesh Jhunjhunwala Late Chandrakant Sampat and many many more....
Though I can't stop mentioning that both Rakesh Jhunjhunwala and R K Damani were traders in their initial days.
Rakesh Jhunjhunwala still trades, he once said Traing is fun, its le fatafat, de fatafat
A lot of people (specially the beginners) buy stocks based on some friend's recommendation : XYZ le le, pukka chalega, maine bhi le rakha hai.
Few might have made money this way, but most do not. Why ?
There has to be a process.
Fundamentals based investing need thorough analysis of the Business & Company.
Here is a preliminary checklist by the legendary investor Peter lynch
1. Go through Zerodha Varsity chapters on Technical Analysis at least 2 times.
2. Then read 'Technical Analysis Explained' by Martin Pring
3. Finally read 'Price Action bar by bar' by Al Books (Not for casual reader).
Sir @DillikiBiili , could you please suggest a book for technical analysis ?
— Pawan Yadav (@pawan_yadav86) March 25, 2022
More from Screeners

#BroTip
If you want to trade only stocks with established trend/momentum, then you can look for stocks which have never(or barely did) closed below a certain MA (say 50MA) in the last say 50 days.
— Manas Arora (@iManasArora) November 8, 2021
There are countless ways to run scans. Just have to get creative. #BroTip


Russell 2000
It is better if you spend considerable time learning these concepts. https://t.co/caBHOO4Owa
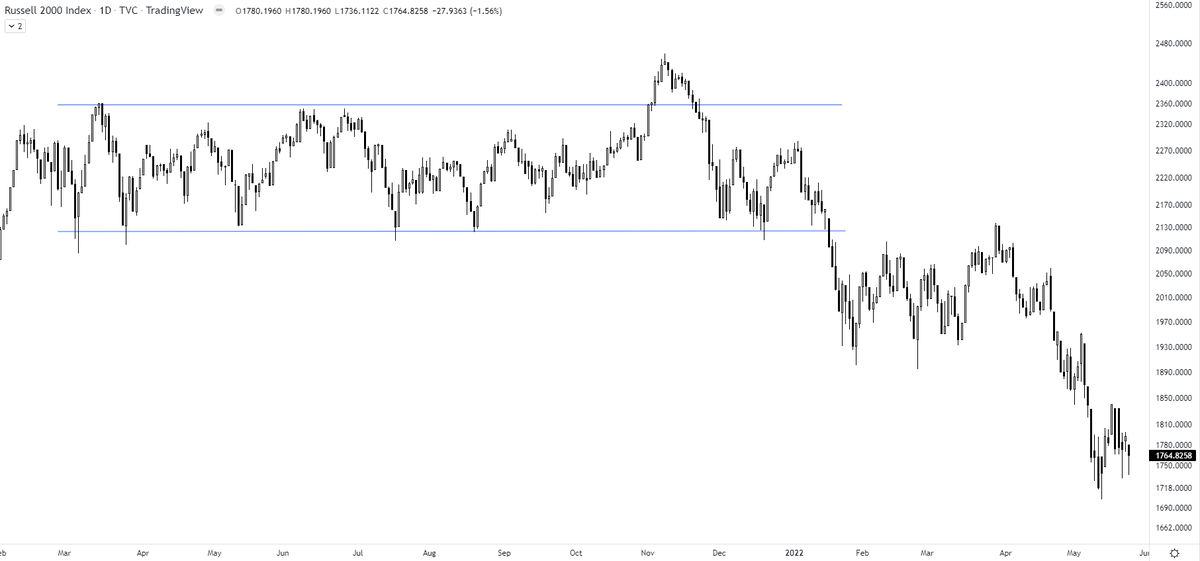
TRAPS? In a false breakout, the price breaks out of the range & comes back within the range. A trap is one step ahead, price not only comes back within the range but breaks down in the opposite direction. It traps the initial longs who didn't close their positions
— The_Chartist \U0001f4c8 (@charts_zone) January 22, 2022
Russell 2000 pic.twitter.com/txzjdnStzc

You May Also Like


Curated the best tweets from the best traders who are exceptional at managing strangles.
• Positional Strangles
• Intraday Strangles
• Position Sizing
• How to do Adjustments
• Plenty of Examples
• When to avoid
• Exit Criteria
How to sell Strangles in weekly expiry as explained by boss himself. @Mitesh_Engr
• When to sell
• How to do Adjustments
• Exit
1. Let's start option selling learning.
— Mitesh Patel (@Mitesh_Engr) February 10, 2019
Strangle selling. ( I am doing mostly in weekly Bank Nifty)
When to sell? When VIX is below 15
Assume spot is at 27500
Sell 27100 PE & 27900 CE
say premium for both 50-50
If bank nifty will move in narrow range u will get profit from both.
Beautiful explanation on positional option selling by @Mitesh_Engr
Sir on how to sell low premium strangles yourself without paying anyone. This is a free mini course in
Few are selling 20-25 Rs positional option selling course.
— Mitesh Patel (@Mitesh_Engr) November 3, 2019
Nothing big deal in that.
For selling weekly option just identify last week low and high.
Now from that low and high keep 1-1.5% distance from strike.
And sell option on both side.
1/n
1st Live example of managing a strangle by Mitesh Sir. @Mitesh_Engr
• Sold Strangles 20% cap used
• Added 20% cap more when in profit
• Booked profitable leg and rolled up
• Kept rolling up profitable leg
• Booked loss in calls
• Sold only
Sold 29200 put and 30500 call
— Mitesh Patel (@Mitesh_Engr) April 12, 2019
Used 20% capital@44 each
2nd example by @Mitesh_Engr Sir on converting a directional trade into strangles. Option Sellers can use this for consistent profit.
• Identified a reversal and sold puts
• Puts decayed a lot
• When achieved 2% profit through puts then sold
Already giving more than 2% return in a week. Now I will prefer to sell 32500 call at 74 to make it strangle in equal ratio.
— Mitesh Patel (@Mitesh_Engr) February 7, 2020
To all. This is free learning for you. How to play option to make consistent return.
Stay tuned and learn it here free of cost. https://t.co/7J7LC86oW0