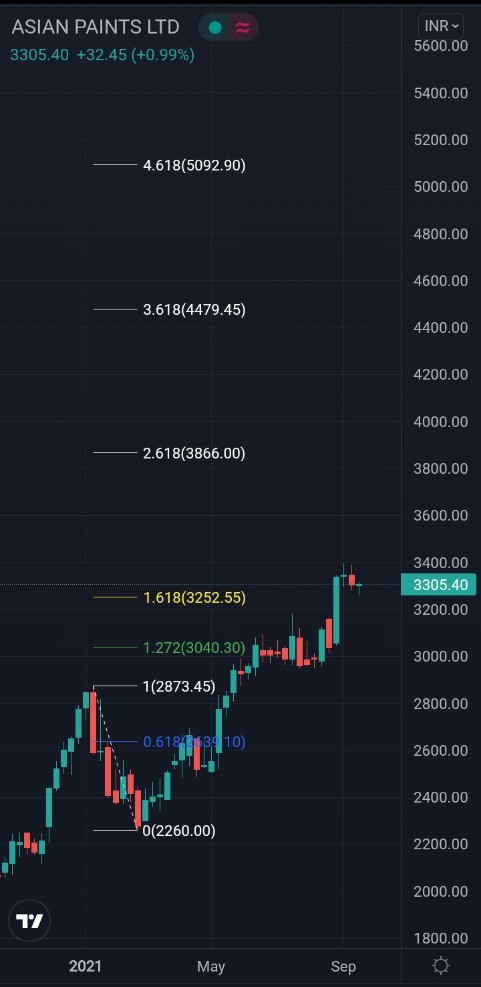
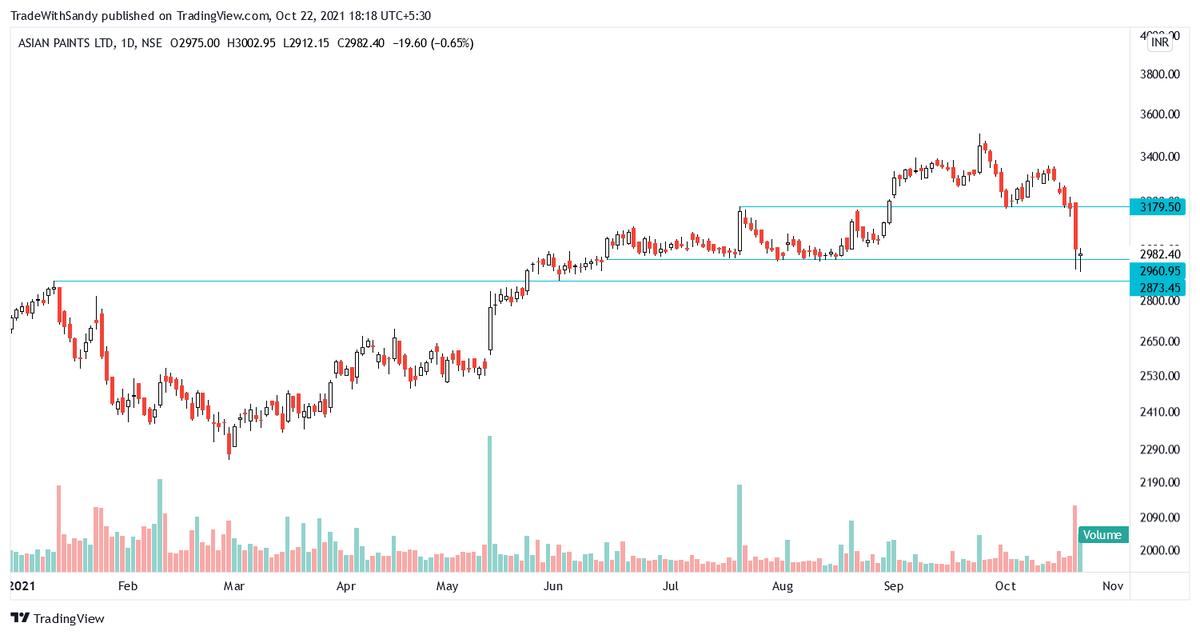
Asian Paints took a bounce exactly from the level given on 21st October.
It has string resistance at 3200, so fresh up-move will be confirmed only when it opens above 3220-3230 levels
#ASIANPAINT
#DKBPositional https://t.co/Q6fTbK5VHM
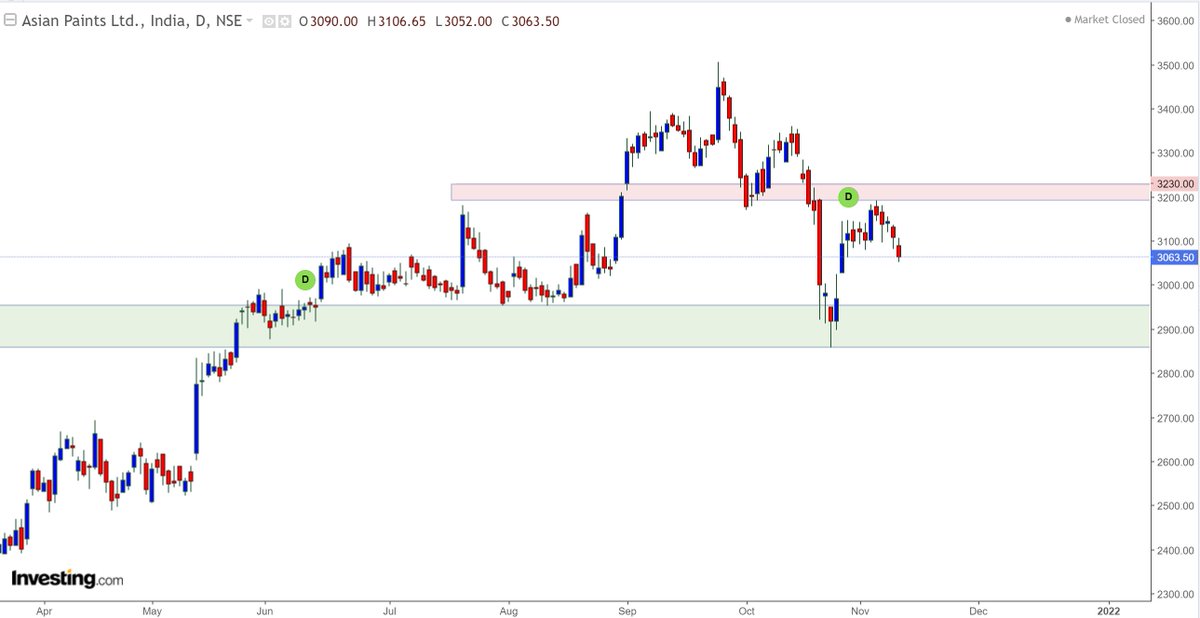
Asian Paints also at crucial support line, bulls desperately need a reversal here, else it'll go in hibernation..... pic.twitter.com/VTfaMfpHXs
— Professor (@DillikiBiili) October 21, 2021
More from Professor
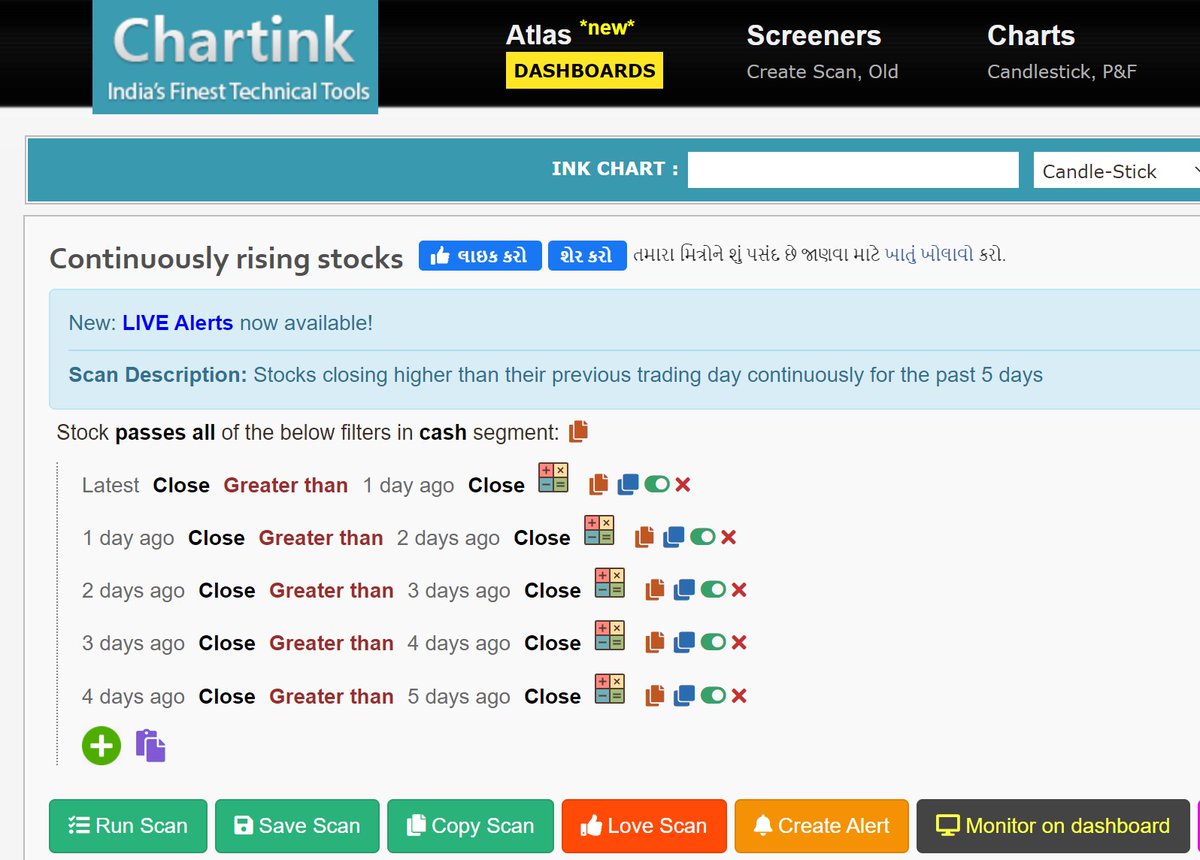
For finding potential breakout candidates, you may run this scanner daily EOD, whenever any new candidate props up, check its chart for signs of breakout.
You may modify & fine tune this as per your own criteria like adding RSI or ADX or other indicators. https://t.co/FdiPG1c4s0
You may modify & fine tune this as per your own criteria like adding RSI or ADX or other indicators. https://t.co/FdiPG1c4s0
Bhai, can you please educate us, how do you find the breakout stocks? I mean which scanner? Any inputs would be much helpful.
— Loyalty Respect (@Novicetrader99) October 1, 2021
OI Data reading seekh lo:
See Large OIl buildup kin strikes par hai and in between strikes data kaise move ho raha hai.
Thumb Rule:
Calls Reduction + Puts addition = Upthrust
Calls Addition + Put Reduction = Down move
Higher the Delta OI velocity, faster is the move.
See Large OIl buildup kin strikes par hai and in between strikes data kaise move ho raha hai.
Thumb Rule:
Calls Reduction + Puts addition = Upthrust
Calls Addition + Put Reduction = Down move
Higher the Delta OI velocity, faster is the move.
For Nifty Intraday Traders: As of now, this seems to be a buy on dip market and looks like there won't be any juicy trades on short side. Will update if data changes. https://t.co/PCIyyPld4A pic.twitter.com/ES3o4z60rY
— Professor (@DillikiBiili) March 11, 2022
More from Asianpaints


You May Also Like


1/OK, data mystery time.
This New York Times feature shows China with a Gini Index of less than 30, which would make it more equal than Canada, France, or the Netherlands. https://t.co/g3Sv6DZTDE
That's weird. Income inequality in China is legendary.
Let's check this number.
2/The New York Times cites the World Bank's recent report, "Fair Progress? Economic Mobility across Generations Around the World".
The report is available here:
3/The World Bank report has a graph in which it appears to show the same value for China's Gini - under 0.3.
The graph cites the World Development Indicators as its source for the income inequality data.

4/The World Development Indicators are available at the World Bank's website.
Here's the Gini index: https://t.co/MvylQzpX6A
It looks as if the latest estimate for China's Gini is 42.2.
That estimate is from 2012.
5/A Gini of 42.2 would put China in the same neighborhood as the U.S., whose Gini was estimated at 41 in 2013.
I can't find the <30 number anywhere. The only other estimate in the tables for China is from 2008, when it was estimated at 42.8.
This New York Times feature shows China with a Gini Index of less than 30, which would make it more equal than Canada, France, or the Netherlands. https://t.co/g3Sv6DZTDE
That's weird. Income inequality in China is legendary.
Let's check this number.
2/The New York Times cites the World Bank's recent report, "Fair Progress? Economic Mobility across Generations Around the World".
The report is available here:
3/The World Bank report has a graph in which it appears to show the same value for China's Gini - under 0.3.
The graph cites the World Development Indicators as its source for the income inequality data.
4/The World Development Indicators are available at the World Bank's website.
Here's the Gini index: https://t.co/MvylQzpX6A
It looks as if the latest estimate for China's Gini is 42.2.
That estimate is from 2012.
5/A Gini of 42.2 would put China in the same neighborhood as the U.S., whose Gini was estimated at 41 in 2013.
I can't find the <30 number anywhere. The only other estimate in the tables for China is from 2008, when it was estimated at 42.8.