I have mentioned before too good material on RS
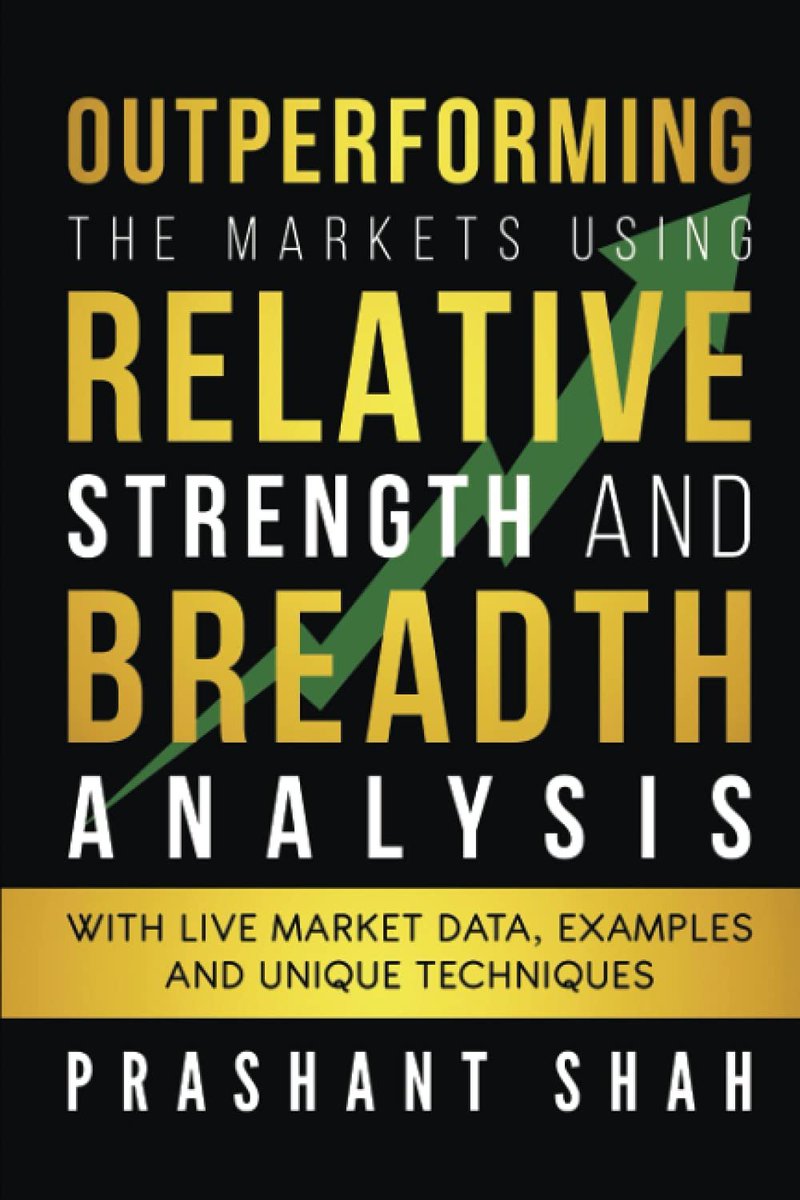
1. A Book written by Sir @Prashantshah267 as attached
2. Research paper by @MebFaber April 2010
3. A book written by Sir Robert A. Levy as attached
4. Webinar by Sir @premalparekh with @vivbajaj
5. Video by @jfahmy on YT https://t.co/xg4fe09ImL
Hi sir ..can u post some articles or write up on relative strength ,how to use same and what is the criteria .. kindly help
— Nanda (@vk_nandagopal) December 11, 2021
More from The_Chartist 📈
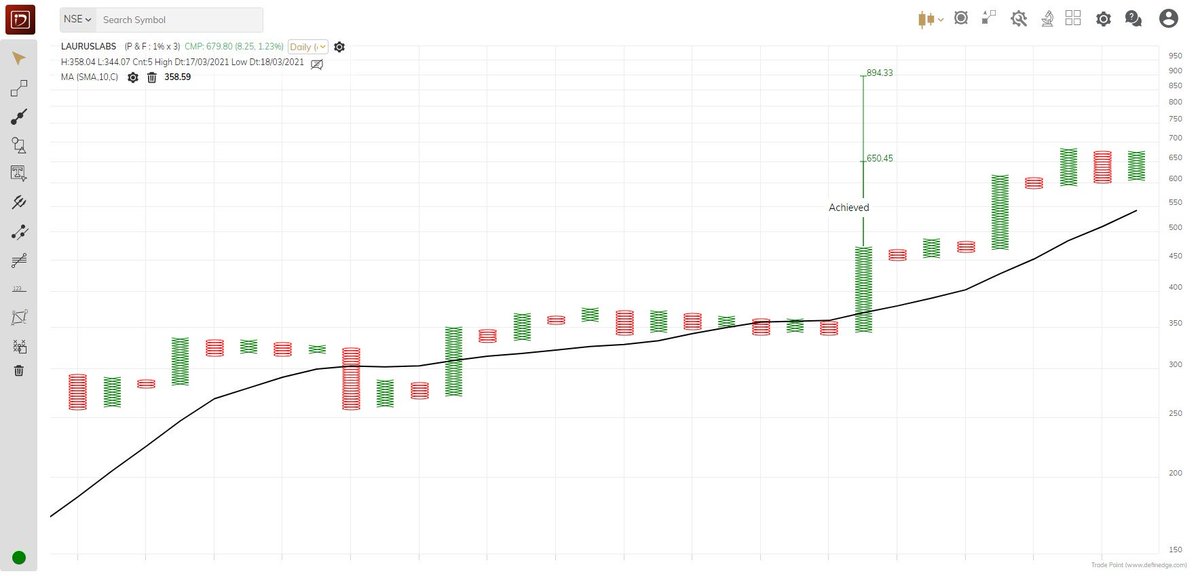
Explained you same concept with Elxsi. The real test of a strong Breakout is that the big hand will not give you another chance to buy the share at the breakout level. They will absorb all the selling of weak hands. I mean "STRONG breakout". https://t.co/7fxFqGQl3p
Tata Elxsi ---
— Steve Nison (@nison_steve) June 30, 2021
In the last 10 minutes, all the selling was absorbed despite intraday positions being squared off (if not converted). will wait for the EOD data. However, the chart structure is extremely strong. https://t.co/pci7GCDBEO pic.twitter.com/1NBD9V3mKc
AWL - look at the ranges of contraction on the chart https://t.co/2XMhqZQu8X
Borosil Renewables - Patterns like these must be looked at carefully and must be kept on the radar. Herein price is contracting which generally signifies shifting of hands (from weak to strong). If you go wrong, the risk is limited in these. pic.twitter.com/iqyoeslZjy
— The_Chartist \U0001f4c8 (@charts_zone) July 12, 2021
USDINR - a breakout that will not bode well for the equities
78+ https://t.co/AWqZxF5B1L
Can you anticipate a breakout? Yes
— The_Chartist \U0001f4c8 (@charts_zone) June 10, 2022
the attached tweet.
now the chart is for USDINR https://t.co/Vb2wKaCvTB pic.twitter.com/INo0GC4fGY
More from Screeners
It's much more powerful than you think
9 things TradingView can do, you'll wish you knew yesterday: 🧵
Collaborated with @niki_poojary
1/ Free Multi Timeframe Analysis
Step 1. Download Vivaldi Browser
Step 2. Login to trading view
Step 3. Open bank nifty chart in 4 separate windows
Step 4. Click on the first tab and shift + click by mouse on the last tab.
Step 5. Select "Tile all 4 tabs"
What happens is you get 4 charts joint on one screen.
Refer to the attached picture.
The best part about this is this is absolutely free to do.
Also, do note:
I do not have the paid version of trading view.
2/ Free Multiple Watchlists
Go through this informative thread where @sarosijghosh teaches you how to create multiple free watchlists in the free
\U0001d5e0\U0001d602\U0001d5f9\U0001d601\U0001d5f6\U0001d5fd\U0001d5f9\U0001d5f2 \U0001d600\U0001d5f2\U0001d5f0\U0001d601\U0001d5fc\U0001d5ff \U0001d604\U0001d5ee\U0001d601\U0001d5f0\U0001d5f5\U0001d5f9\U0001d5f6\U0001d600\U0001d601 \U0001d5fc\U0001d5fb \U0001d5e7\U0001d5ff\U0001d5ee\U0001d5f1\U0001d5f6\U0001d5fb\U0001d5f4\U0001d603\U0001d5f6\U0001d5f2\U0001d604 \U0001d602\U0001d600\U0001d5f6\U0001d5fb\U0001d5f4 \U0001d601\U0001d5f5\U0001d5f2 \U0001d5d9\U0001d5e5\U0001d5d8\U0001d5d8 \U0001d603\U0001d5f2\U0001d5ff\U0001d600\U0001d5f6\U0001d5fc\U0001d5fb!
— Sarosij Ghosh (@sarosijghosh) September 18, 2021
A THREAD \U0001f9f5
Please Like and Re-Tweet. It took a lot of effort to put this together. #StockMarket #TradingView #trading #watchlist #Nifty500 #stockstowatch
3/ Free Segregation into different headers/sectors
You can create multiple sections sector-wise for free.
1. Long tap on any index/stock and click on "Add section above."
2. Secgregate the stocks/indices based on where they belong.
Kinda like how I did in the picture below.
You May Also Like
Decoded his way of analysis/logics for everyone to easily understand.
Have covered:
1. Analysis of volatility, how to foresee/signs.
2. Workbook
3. When to sell options
4. Diff category of days
5. How movement of option prices tell us what will happen
1. Keeps following volatility super closely.
Makes 7-8 different strategies to give him a sense of what's going on.
Whichever gives highest profit he trades in.
I am quite different from your style. I follow the market's volatility very closely. I have mock positions in 7-8 different strategies which allows me to stay connected. Whichever gives best profit is usually the one i trade in.
— Sarang Sood (@SarangSood) August 13, 2019
2. Theta falls when market moves.
Falls where market is headed towards not on our original position.
Anilji most of the time these days Theta only falls when market moves. So the Theta actually falls where market has moved to, not where our position was in the first place. By shifting we can come close to capturing the Theta fall but not always.
— Sarang Sood (@SarangSood) June 24, 2019
3. If you're an options seller then sell only when volatility is dropping, there is a high probability of you making the right trade and getting profit as a result
He believes in a market operator, if market mover sells volatility Sarang Sir joins him.
This week has been great so far. The main aim is to be in the right side of the volatility, rest the market will reward.
— Sarang Sood (@SarangSood) July 3, 2019
4. Theta decay vs Fall in vega
Sell when Vega is falling rather than for theta decay. You won't be trapped and higher probability of making profit.
There is a difference between theta decay & fall in vega. Decay is certain but there is no guaranteed profit as delta moves can increase cost. Fall in vega on the other hand is backed by a powerful force that sells options and gives handsome returns. Our job is to identify them.
— Sarang Sood (@SarangSood) February 12, 2020