Yes, I use Price Strength ranking provided on https://t.co/pKpa3N7MQC and keep the stocks with ranking >80 on priority.
I do use Mark Minervini template for screening but it's a little basic, so I added Volatility & Volume filters to it to shorten the watchlist.
More from Ravi Sharma
Reason and pre-analysis for #BAJAJFINSV before buy-
While buying breakouts, your odds will improve a lot when you prefer the following:
1. Strong Relative Strength.
2. Tight price range on low Volume and a pattern which is easy on eyes. https://t.co/CprKpAfgtj
While buying breakouts, your odds will improve a lot when you prefer the following:
1. Strong Relative Strength.
2. Tight price range on low Volume and a pattern which is easy on eyes. https://t.co/CprKpAfgtj
#BAJAJFINSV
— Ravi Sharma (@StocksNerd) August 14, 2021
Setting up in a tight base. Volume has been drying up.
Waiting for the breakout. pic.twitter.com/KWoGZAwkLO
These are long term Moving Averages, which in my view are irrelevant for short term positional trades.
For my trading strategy, 13-day & 22-day EMAs are more suitable.
If SmallCap dips below these MAs & they get into the bearish sync, I get cautious & reduce my position size.
For my trading strategy, 13-day & 22-day EMAs are more suitable.
If SmallCap dips below these MAs & they get into the bearish sync, I get cautious & reduce my position size.
Sir as you follow the smallcap index,do you take full positions when it\u2019s trading below its key moving averages or wait for some confirmation? pic.twitter.com/ph6HTJ9rbD
— Dhanesh Gianani (@dhanesh500) November 30, 2021
I have been asked a lot about how to determine the direction of the broader market.
I have made some minor tweakings to this timing model since this tweet but it still will give you an idea and primer 👇
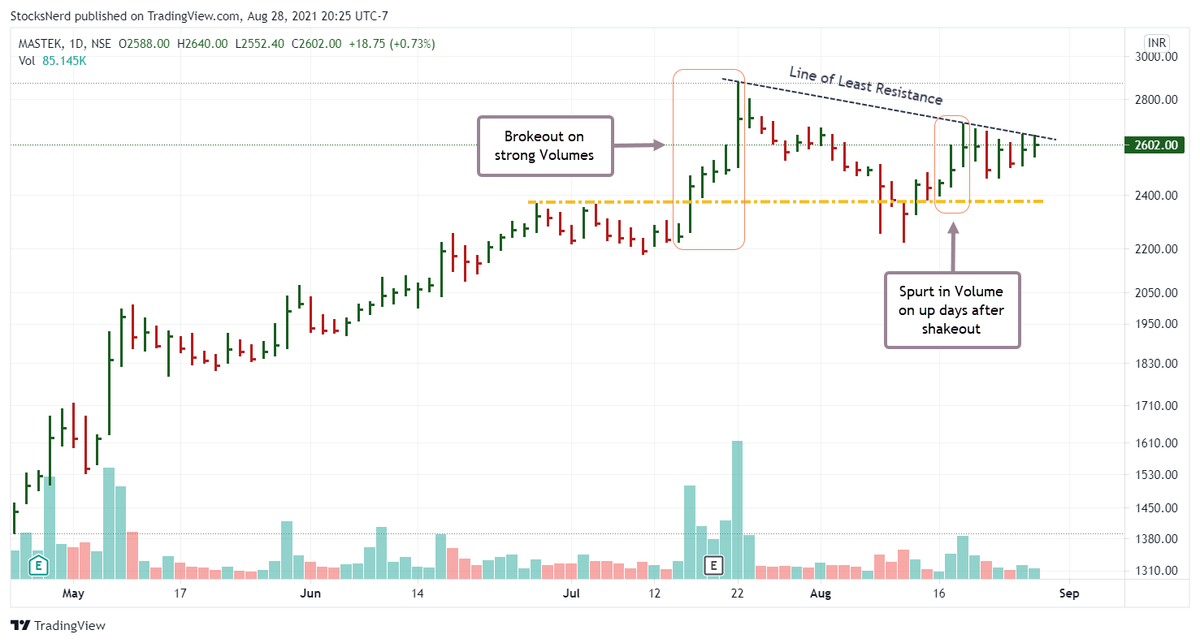
Trading 101 with SmallCap Index
— Ravi Sharma (@StocksNerd) August 20, 2019
1. Swing trades when bullish divergence in MACD-H forms
2. Breakout trades if Index closes above 22-Day high
3. Pullback/Pocket Pivot trades if Index consolidates constructively while13-EMA>22-EMA
4. Sell, go cash if Index breaches 10-Day low, NQA pic.twitter.com/u8VjXrU0Re
It's a secret recipe 😋
But I can give you some pointers-
1) Choose stocks in Stage 2 with RS > 75
2) Identify these setups - Cup with Handle, High Tight Flag, Rectangle, VCP, Squat, Low Cheat, 3-C.
2) Wait for the significant contraction in daily range, volatility & Volume.
But I can give you some pointers-
1) Choose stocks in Stage 2 with RS > 75
2) Identify these setups - Cup with Handle, High Tight Flag, Rectangle, VCP, Squat, Low Cheat, 3-C.
2) Wait for the significant contraction in daily range, volatility & Volume.
How do u screen stocks???
— \u2206bhishek Jain (@AbhishekTMM) August 6, 2021
More from Screeners
You May Also Like
1/OK, data mystery time.
This New York Times feature shows China with a Gini Index of less than 30, which would make it more equal than Canada, France, or the Netherlands. https://t.co/g3Sv6DZTDE
That's weird. Income inequality in China is legendary.
Let's check this number.
2/The New York Times cites the World Bank's recent report, "Fair Progress? Economic Mobility across Generations Around the World".
The report is available here:
3/The World Bank report has a graph in which it appears to show the same value for China's Gini - under 0.3.
The graph cites the World Development Indicators as its source for the income inequality data.
4/The World Development Indicators are available at the World Bank's website.
Here's the Gini index: https://t.co/MvylQzpX6A
It looks as if the latest estimate for China's Gini is 42.2.
That estimate is from 2012.
5/A Gini of 42.2 would put China in the same neighborhood as the U.S., whose Gini was estimated at 41 in 2013.
I can't find the <30 number anywhere. The only other estimate in the tables for China is from 2008, when it was estimated at 42.8.