
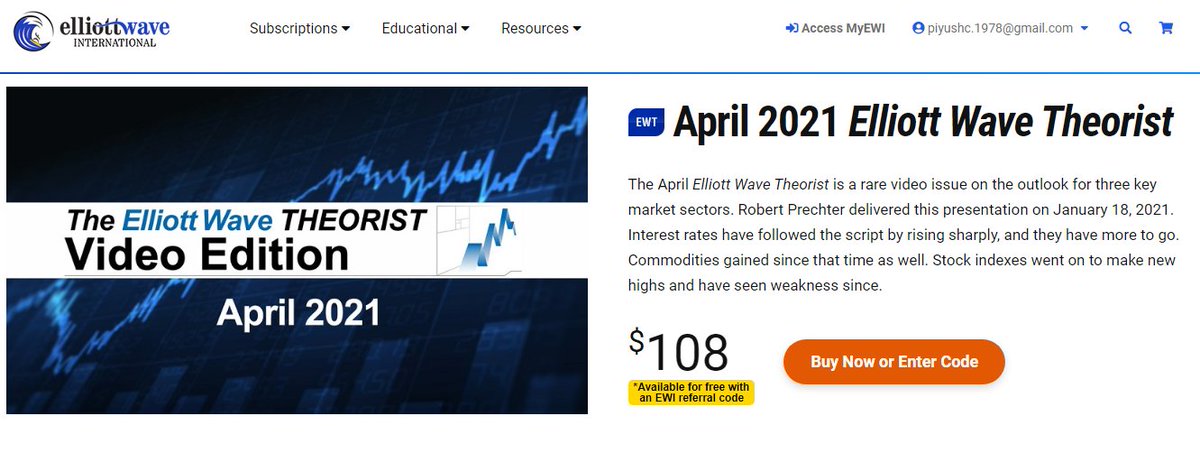
EWI has given me the OK to share Mr Robert Prechter's April Elliott Wave Theorist, FREE. It gives his outlook for 3 Markets - Stocks, Commodities & Interest Rates. All 3 are following his projections. Visit this link https://t.co/fbNFWM5X5b & enter my special code: PIYUSH
More from Piyush Chaudhry
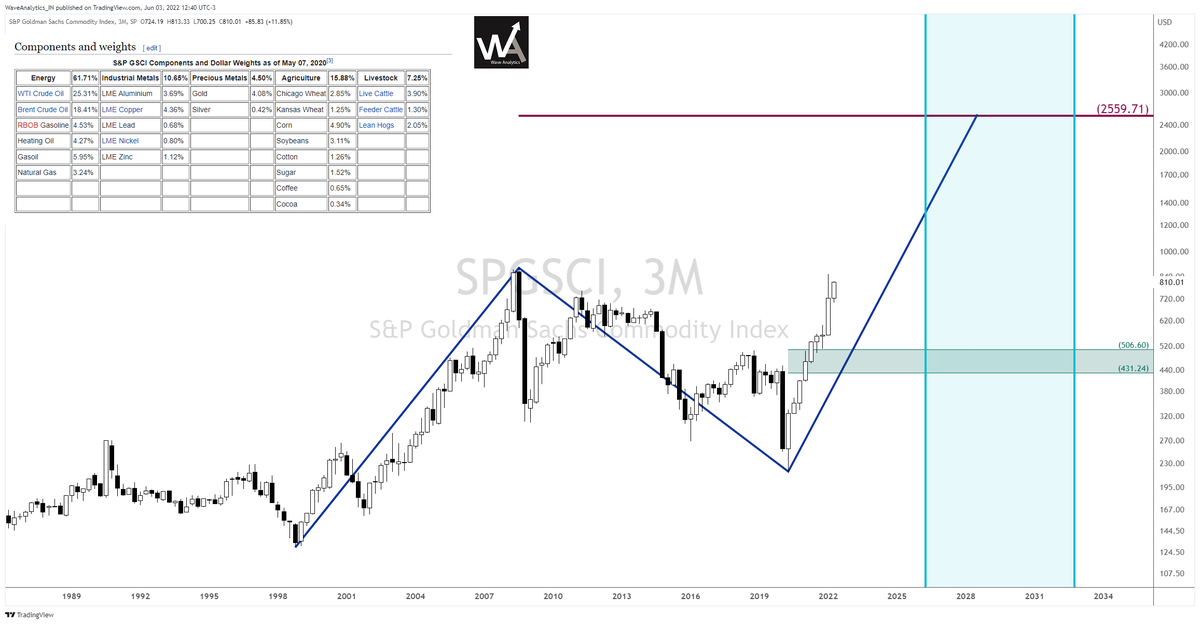
#APOLLOHOSP @ 2110 - Long Term Chart.
— Piyush Chaudhry (@piyushchaudhry) November 12, 2020
I see a fair possibility of the stock rising to 3500-5000 zone over next few years and an open possibility of the next zone of 5000-7500 as well.
Invalidation on break below Blue TL. pic.twitter.com/QJ5aY4eTT8

More from Stocklearnings


A 2019 Tweet.
#GapTheory - Do the Gaps get filled?
— Piyush Chaudhry (@piyushchaudhry) March 12, 2019
As per Thomas Bulkowski's 2005 study Odds for filling of the following Gaps -
Common Gaps: >70%
However,
Breakaway Gaps: <5%
Runaway Gaps: <20%
Exhaustion Gaps: >70%
Categorize the Gaps correctly and Look for Counter Signals.


An inverse occurrence is about to witness failure, awaiting for its impact .
#CandleTrading tag would help you understand more of some of these ancient yet effective techniques...
#CandleTrading : #Bullish #Belthold#Pattern #Psychology :Pattern importance could be traced back to the traditional #Japanese sport of \u2018Sumo #wrestling'. The importance of \u2018Mawashi ( Wrestlers Belt) \u2019 & its tactical move for gripping the opponent to throwing him off the ring. pic.twitter.com/lN60xad6Ma
— Sacchitanand Uttekar (@Sacchitananad) August 16, 2020
You May Also Like












1 - open trading view in your browser and select stock scanner in left corner down side .
2 - touch the percentage% gain change ( and u can see higest gainer of today)
Making thread \U0001f9f5 on trading view scanner by which you can select intraday and btst stocks .
— Vikrant (@Trading0secrets) October 22, 2021
In just few hours (Without any watchlist)
Some manual efforts u have to put on it.
Soon going to share the process with u whenever it will be ready .
"How's the josh?"guys \U0001f57a\U0001f3b7\U0001f483
3. Then, start with 6% gainer to 20% gainer and look charts of everyone in daily Timeframe . (For fno selection u can choose 1% to 4% )
4. Then manually select the stocks which are going to give all time high BO or 52 high BO or already given.
5. U can also select those stocks which are going to give range breakout or already given range BO
6 . If in 15 min chart📊 any stock sustaing near BO zone or after BO then select it on your watchlist
7 . Now next day if any stock show momentum u can take trade in it with RM
This looks very easy & simple but,
U will amazed to see it's result if you follow proper risk management.
I did 4x my capital by trading in only momentum stocks.
I will keep sharing such learning thread 🧵 for you 🙏💞🙏
Keep learning / keep sharing 🙏
@AdityaTodmal