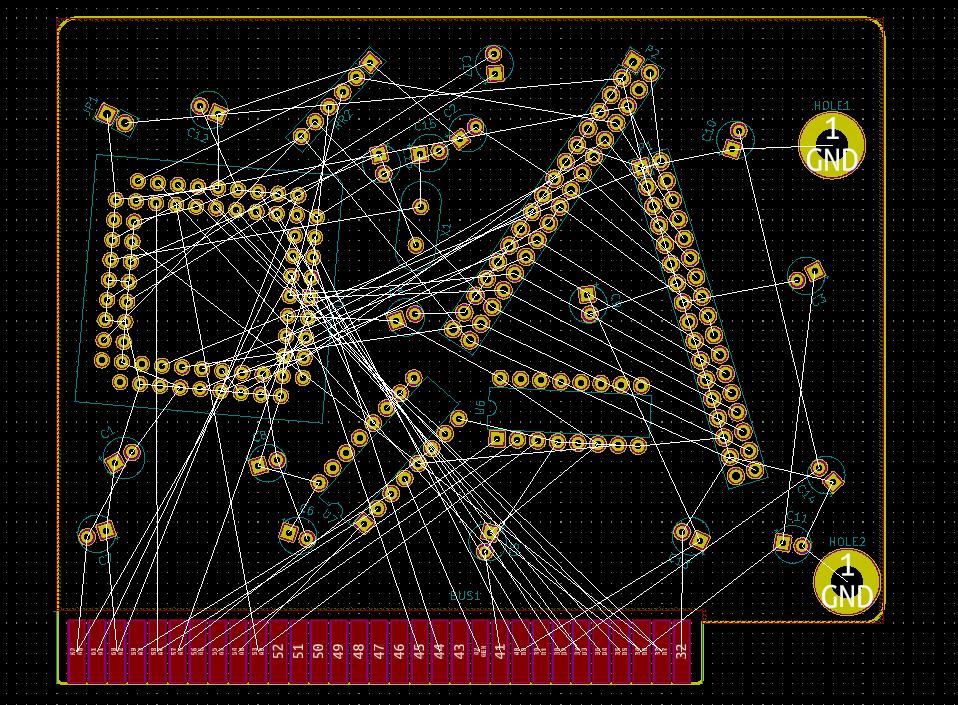
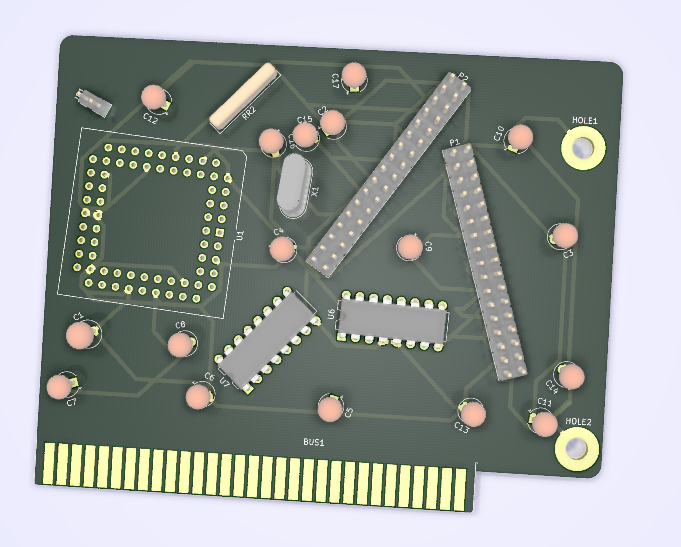
I think I've permanently confused KiCAD
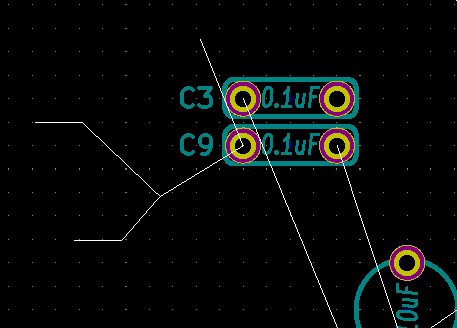
it's reminding me that I need to connect this capacitor to Nothing


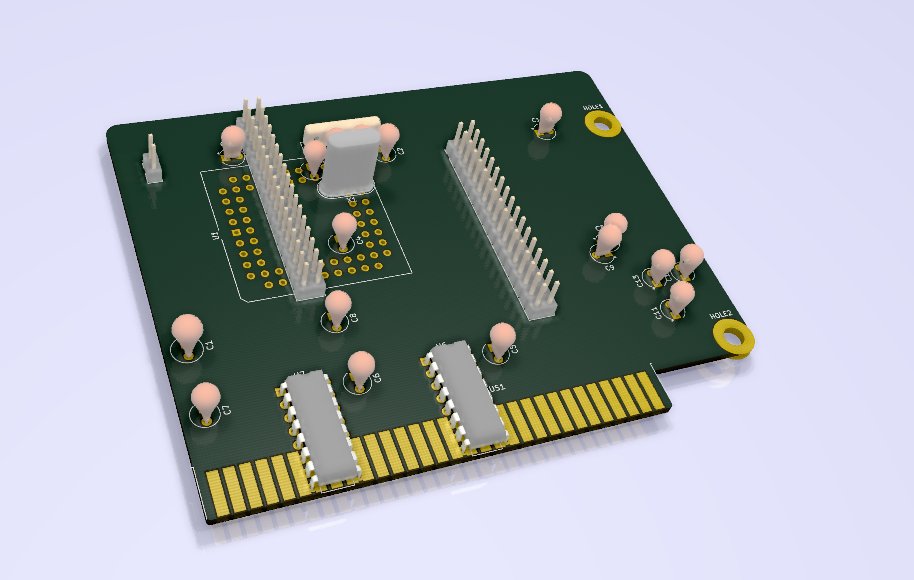
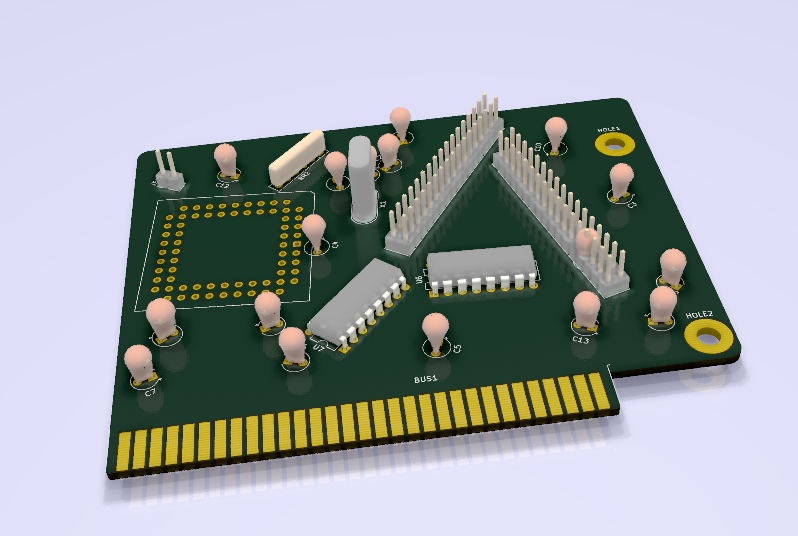
they have an ISA footprint but it doesn't show up when you search for "ISA" because they called it BUS_AT despite it being clearly called "ISA" since THE LATE 80s

The full AT bus, the 16bit extension to the 8bit PC/XT bus!


this will fix and/or cause all my problems
look at this.
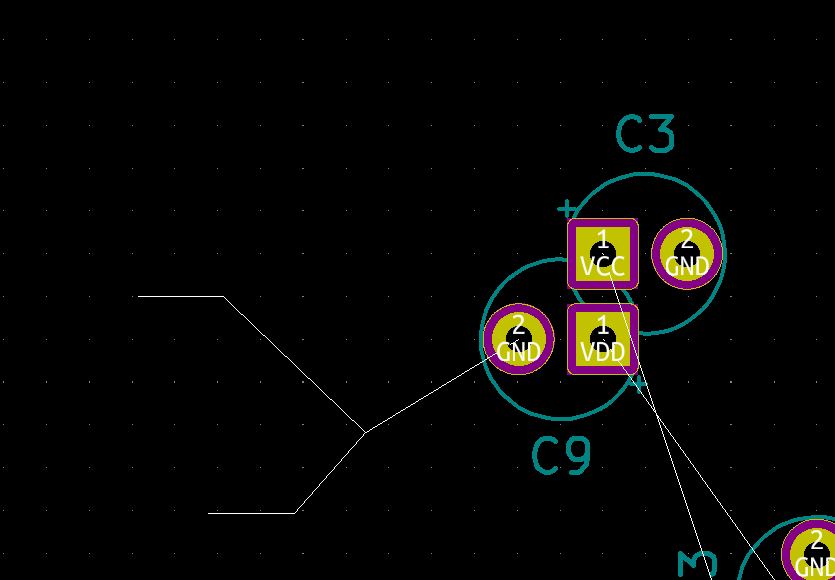
it's the wrong 3D library, as that's just the footprint not the socket. I don't even know if here's a socket, so I'd like to look.
See the 3D model path? it's in Package_LCC.3dshapes


1. the source for kicad which points at this non-existent file
2. @TubeTimeUS's PlaidBib project which points at "Housings_LCC.3dshapes/PLCC-68_THT-Socket.wrl", which is a slightly different path!


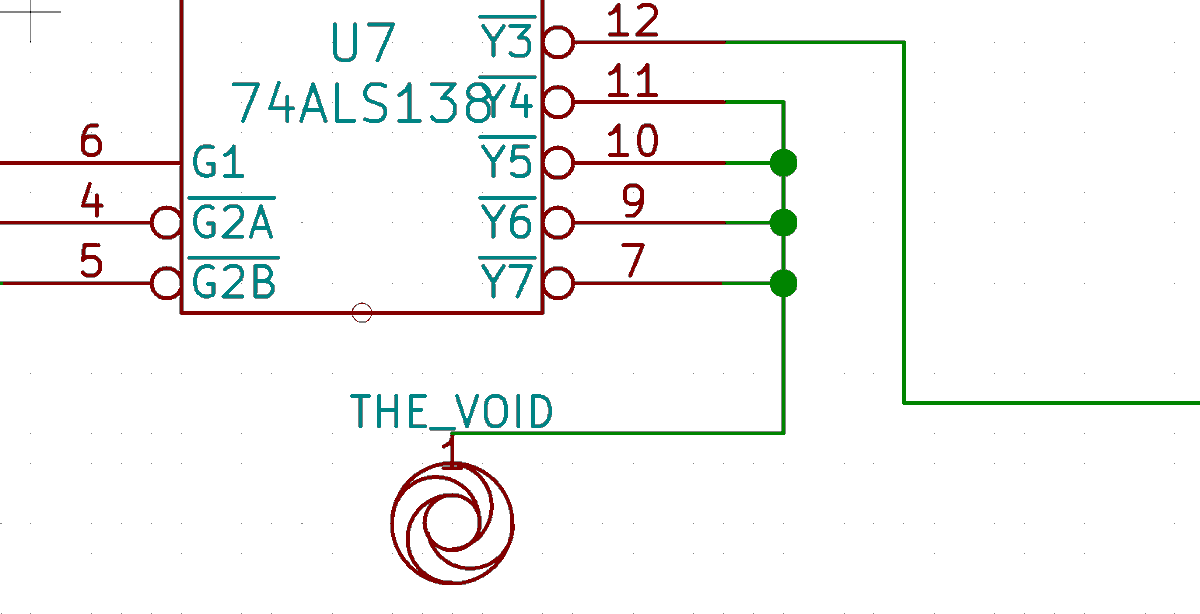
https://t.co/6pHY6xZkCZ
Drinks available:
— foone (@Foone) March 24, 2019
Sprite
Diet Coke
\uff34 \uff28 \uff25 \uff36 \uff2f \uff29 \uff24 pic.twitter.com/t2FXeaJAyy
why
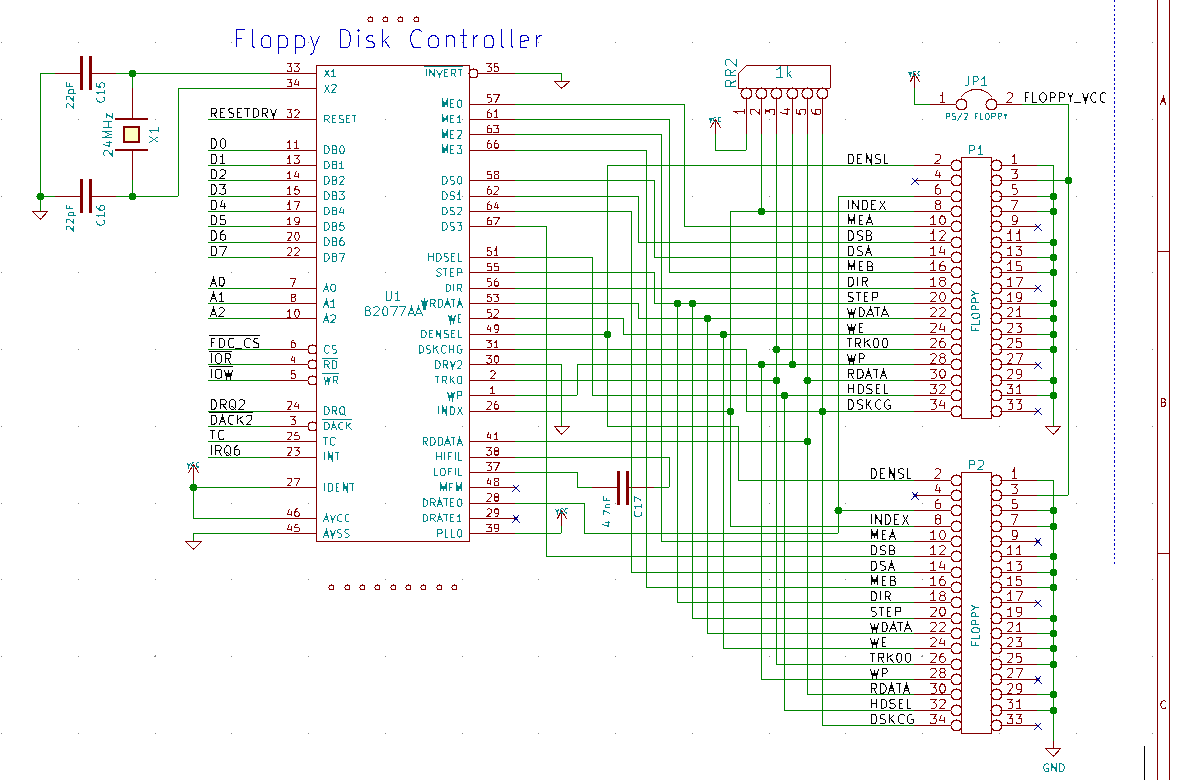
TWO HOURS LATER I'M DESIGNING A FLOPPY DISK CONTROLLER
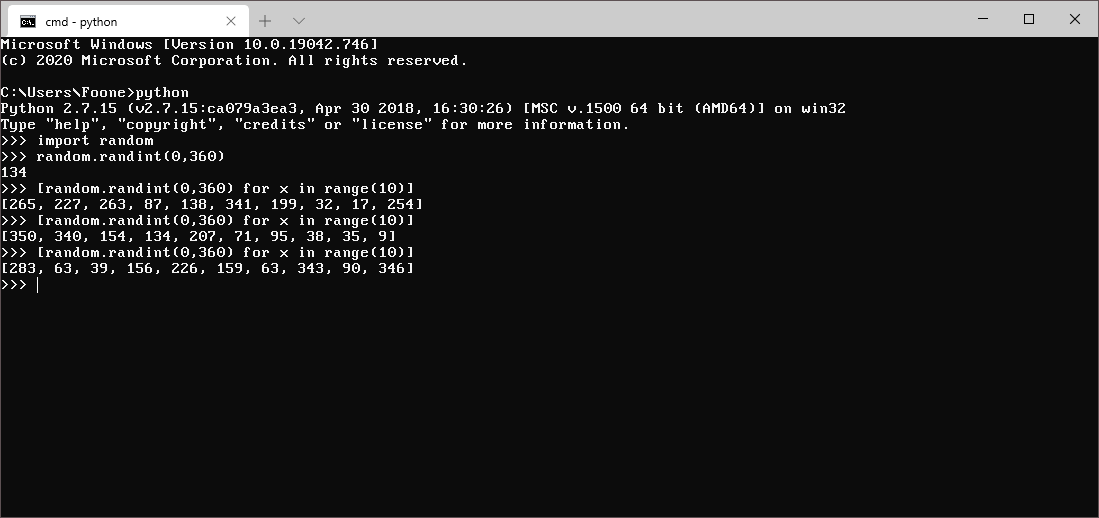
Obviously I let a computer generate the randomness, I'm not a barbarian.
More from foone







More from Science

1. I find it remarkable that some medics and scientists aren’t raising their voices to make children as safe as possible. The comment about children being less infectious than adults is unsupported by evidence.
2. @c_drosten has talked about this extensively and @dgurdasani1 and @DrZoeHyde have repeatedly pointed out flaws in the studies which have purported to show this. Now for the other assertion: children are very rarely ill with COVID19.
3. Children seem to suffer less with acute illness, but we have no idea of the long-term impact of infection. We do know #LongCovid affects some children. @LongCovidKids now speaks for 1,500 children struggling with a wide range of long-term symptoms.
4. 1,500 children whose parents found a small campaign group. How many more are out there? We don’t know. ONS data suggests there might be many, but the issue hasn’t been studied sufficiently well or long enough for a definitive answer.
5. Some people have talked about #COVID19 being this generation’s Polio. According to US CDC, Polio resulted in inapparent infection in more than 99% of people. Severe disease occurred in a tiny fraction of those infected. Source:
I find it remarkable that a section of society not rejoicing that children very rarely ill with COVID compared to other viruses and much less infectious than adults
— Michael Absoud \U0001f499 (@MAbsoud) February 12, 2021
Instead trying prove the opposite!
Why??
2. @c_drosten has talked about this extensively and @dgurdasani1 and @DrZoeHyde have repeatedly pointed out flaws in the studies which have purported to show this. Now for the other assertion: children are very rarely ill with COVID19.
3. Children seem to suffer less with acute illness, but we have no idea of the long-term impact of infection. We do know #LongCovid affects some children. @LongCovidKids now speaks for 1,500 children struggling with a wide range of long-term symptoms.
4. 1,500 children whose parents found a small campaign group. How many more are out there? We don’t know. ONS data suggests there might be many, but the issue hasn’t been studied sufficiently well or long enough for a definitive answer.
5. Some people have talked about #COVID19 being this generation’s Polio. According to US CDC, Polio resulted in inapparent infection in more than 99% of people. Severe disease occurred in a tiny fraction of those infected. Source:


"The new answer to a 77-year-old problem"
😭
https://t.co/hm9NoaU4nr
https://t.co/8fKDiKjSWc
https://t.co/jkaicC1F2x
https://t.co/PpxWT4Jef4
😭
The new answer to a 77-year-old problem in data analysis, published today in @naturemethods. Instead of significance tests, use estimation graphics. Our software suite DABEST makes it easy for everyone to visualize effect sizes.https://t.co/UzwXJ7EUC5 pic.twitter.com/VtxyY0xaRM
— Adam Claridge-Chang (@adamcchang) June 19, 2019
https://t.co/hm9NoaU4nr
Open letter to journal editors: dynamite plots must die. Dynamite plots, also known as bar and line graphs, hide important information. Editors should require authors to show readers the data and avoid these plots. https://t.co/0GNKEIUCJL pic.twitter.com/OS9ytEFRZN
— Rafael Irizarry (@rafalab) February 22, 2019
https://t.co/8fKDiKjSWc
Couldn't find D3 code for grouped horisontal box plots that show data points so I made this @mbostock @thisisalfie https://t.co/cQjDPhyZdw pic.twitter.com/y6RNmDB2p3
— Ulrik Lyngs (@ulyngs) June 28, 2017
https://t.co/jkaicC1F2x
made a pkg for pirate plots in ggplot: add any of points/means/bars/CIs/violins \u2013 better than ye olde bar/box plotshttps://t.co/Z2m2kW3hsl pic.twitter.com/npAirPQexM
— Mika Braginsky (@mbraginsky) September 28, 2017
https://t.co/PpxWT4Jef4
See the new #PowerBI visual awesomeness for data points & sources, box-&-whisker plots! https://t.co/dOmgoxWfDE pic.twitter.com/HAUOAMJEJW
— Microsoft Power BI (@MSPowerBI) February 1, 2016


You May Also Like

"I really want to break into Product Management"
make products.
"If only someone would tell me how I can get a startup to notice me."
Make Products.
"I guess it's impossible and I'll never break into the industry."
MAKE PRODUCTS.
Courtesy of @edbrisson's wonderful thread on breaking into comics – https://t.co/TgNblNSCBj – here is why the same applies to Product Management, too.
There is no better way of learning the craft of product, or proving your potential to employers, than just doing it.
You do not need anybody's permission. We don't have diplomas, nor doctorates. We can barely agree on a single standard of what a Product Manager is supposed to do.
But – there is at least one blindingly obvious industry consensus – a Product Manager makes Products.
And they don't need to be kept at the exact right temperature, given endless resource, or carefully protected in order to do this.
They find their own way.
make products.
"If only someone would tell me how I can get a startup to notice me."
Make Products.
"I guess it's impossible and I'll never break into the industry."
MAKE PRODUCTS.
Courtesy of @edbrisson's wonderful thread on breaking into comics – https://t.co/TgNblNSCBj – here is why the same applies to Product Management, too.
"I really want to break into comics"
— Ed Brisson (@edbrisson) December 4, 2018
make comics.
"If only someone would tell me how I can get an editor to notice me."
Make Comics.
"I guess it's impossible and I'll never break into the industry."
MAKE COMICS.
There is no better way of learning the craft of product, or proving your potential to employers, than just doing it.
You do not need anybody's permission. We don't have diplomas, nor doctorates. We can barely agree on a single standard of what a Product Manager is supposed to do.
But – there is at least one blindingly obvious industry consensus – a Product Manager makes Products.
And they don't need to be kept at the exact right temperature, given endless resource, or carefully protected in order to do this.
They find their own way.