How to Avoid Big Losses In trading ?

1. Avoid Stocks Below 200 ema
2. Sell Stocks in Stage 4 Down Trend
3. Dont Trade Stocks that are moving in Circuits
4. Avoid News based Trading

A thread With examples๐Ÿ”–

Retweet to Educate Your Trading Friends !
1/n

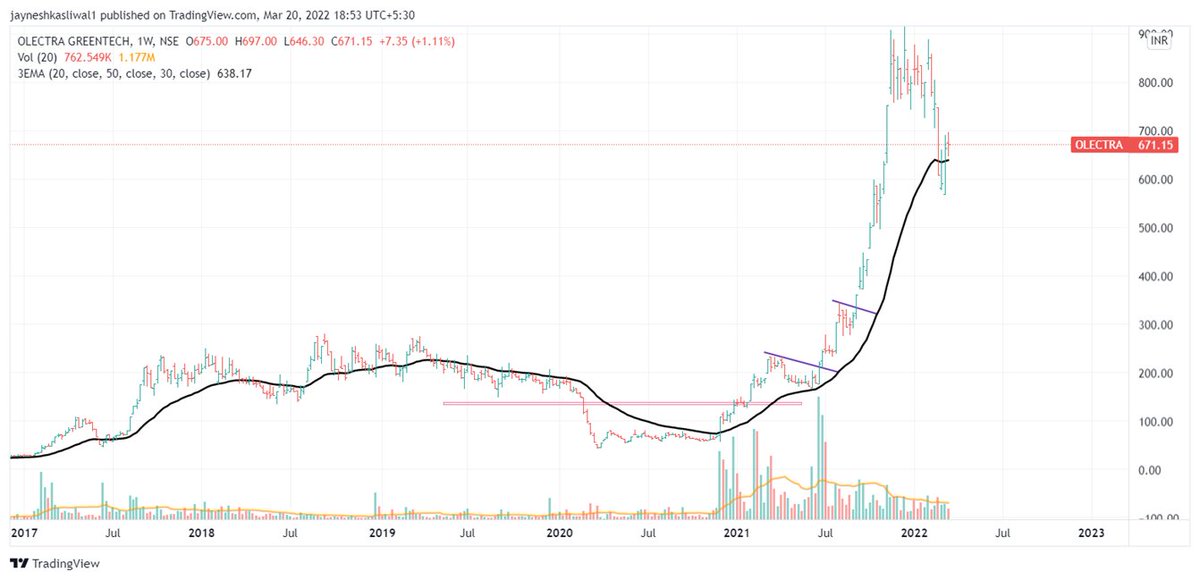
A Study Shows that 90% of the winning Stocks stay above 200 ema before a big Advancing Phase

1. Simply Not Holding or Buying Stocks below 200 ema Saves a lot of time and Money.
2. You can looses opportunity Cost if you buy stocks below 200 ema.
3. TimeFrame: Daily 200 ema

2/n
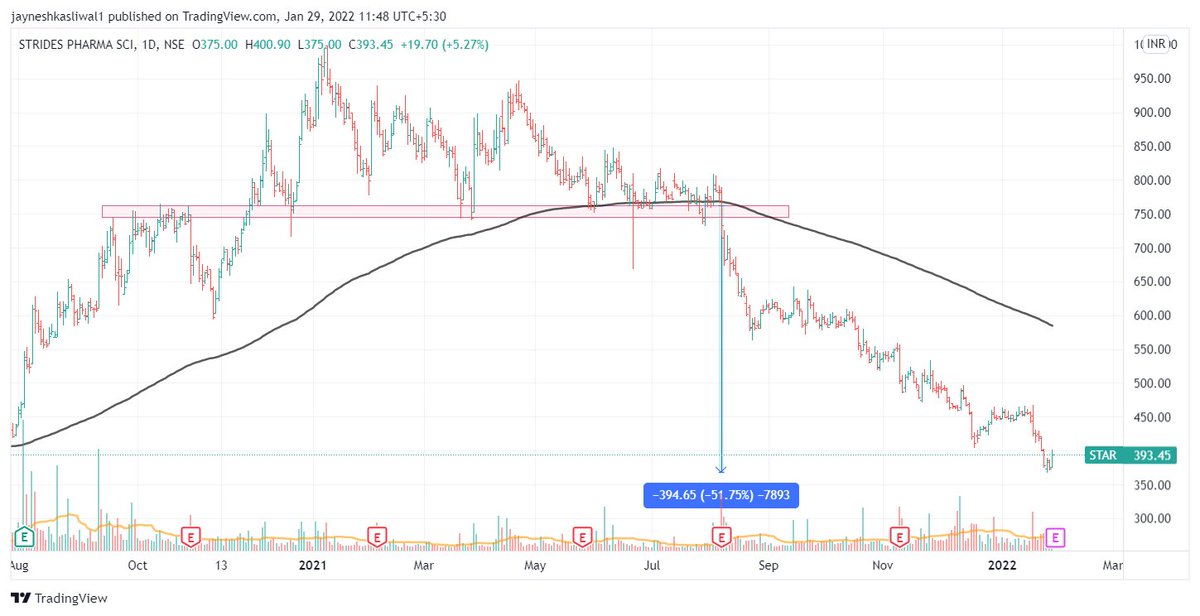
B. Sell Stocks in Stage 4 Down Trend

1. Stocks Exhibiting this are in complete Bear Grip
2. The 30 week ema acts as reference for stage analysis
3. These Stocks can be short sold on pullback to 30wema
4. Happens after Topping Phase
5. TimeFrame : Weekly , 30 Week Ema

3/n
C. Dont Trade Stocks that are moving in Circuits

1. Mostly these stocks are Speculatve and Operator Driven.
2. You never know what is the top of the trend and may get Stuck with Huge Losses

Example : TTML , Alok , Ruchi etc
This is Pyramid Structure and news driven also
4/n
D. Avoid News based Trading
1. Whenever a postive News comes in Market People Jump in Buying the Stocks without thinking .
2. Most of the the times the news is factored in or gets factored after heavy buying
3. Your Money may get Stuck

Example : PnbBousing , AdaniPower
5/n
https://t.co/9X5zlHBGN0

Subscribe to my New YouTube Channel and watch Exclusive Content
https://t.co/b4N4oPAto9
Follow Telegram and @JayneshKasliwal for Exciting Content on stock Market .

More from JayneshKasliwal

๐Ÿฑ ๐—ง๐—ฟ๐—ฎ๐—ฑ๐—ถ๐—ป๐—ด๐˜ƒ๐—ถ๐—ฒ๐˜„ ๐—œ๐—ป๐—ฑ๐—ถ๐—ฐ๐—ฎ๐˜๐—ผ๐—ฟ๐˜€ ๐—ฎ๐—น๐—น ๐—ง๐—ฟ๐—ฎ๐—ฑ๐—ฒ๐—ฟ๐˜€ ๐˜€๐—ต๐—ผ๐˜‚๐—น๐—ฑ ๐—ธ๐—ป๐—ผ๐˜„ ๐—ฎ๐—ฏ๐—ผ๐˜‚๐˜:
๐—ฃ๐—ฎ๐—ฟ๐˜ ๐Ÿฎ

๐Ÿงต Thread ๐Ÿงต
Retweet And I will Link a 36 Page PDF

๐Ÿญ. ๐—”๐—ฑ๐—ฑ ๐—™๐˜‚๐—ป๐—ฑ๐—ฎ๐—บ๐—ฒ๐—ป๐˜๐—ฎ๐—น๐˜€ ๐—ผ๐—ป ๐—ฐ๐—ต๐—ฎ๐—ฟ๐˜
๐Ÿ”ธ Link:
https://t.co/zG165Xa3JB
๐Ÿ”ธ Click on the above link -> Add to Favourites -> Add on Chart from favourites and start using it !
2/20

You can add financials from many fundamental criteria's like
๐Ÿ”ธ Cashflows
๐Ÿ”ธ Income Statements
๐Ÿ”ธ Balance sheets
๐Ÿ”ธ PE,PB ratios
๐Ÿ”ธ Marketcapitlization
๐Ÿ”ธ Statistics
3/20


How to change Settings:
๐Ÿ”ธ There are 8 columns you can basically select any financial you want
๐Ÿ”ธ You can select quarterly or Yearly values and can also write
๐Ÿ”ธ The names of the financiaLS Example : EPS Qtr3
๐Ÿ”ธ You can Change colours , font size
4/20


๐Ÿฎ. ๐—œ๐—ป๐—ฑ๐—ถ๐—ฐ๐—ฎ๐˜๐—ผ๐—ฟ ๐—ฅ๐—ฎ๐˜๐—ถ๐—ป๐—ด๐˜€
You cannot track each and every indicator like ( ๐— ๐—ผ๐˜ƒ๐—ถ๐—ป๐—ด ๐—”๐˜ƒ๐—ด๐˜€ , ๐—ฅ๐—ฆ๐—œ , ๐— ๐—”๐—–๐—— ) etc , you can use plot this custom strategy to understand whether the trend is positive or negative of those indicators
5/20

More from Trading

You May Also Like