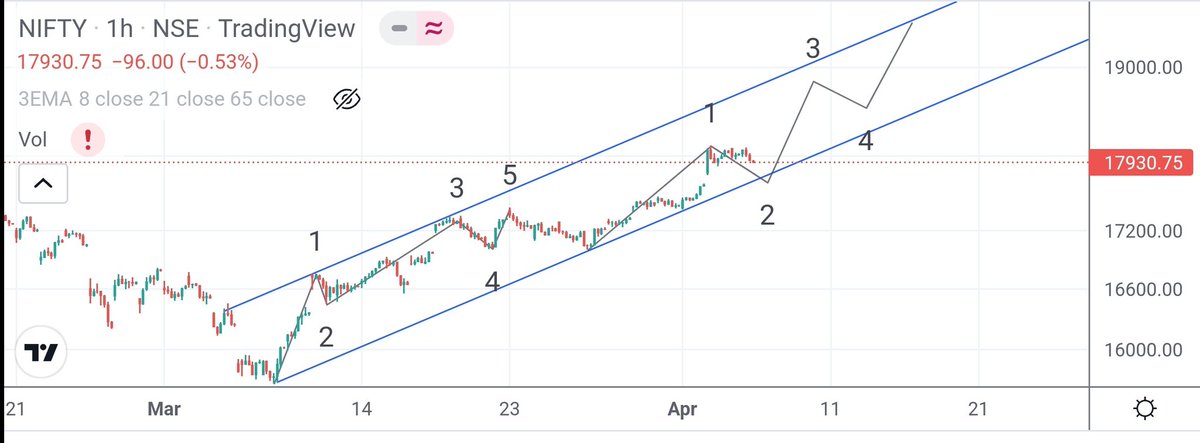
Having the same view as before in Nifty. Is it a prediction? No, it is calculated trajectory based on the historical fractals. Manual version of backtest with a tinge of experience.
#Nifty50 https://t.co/ajpEwosu3v
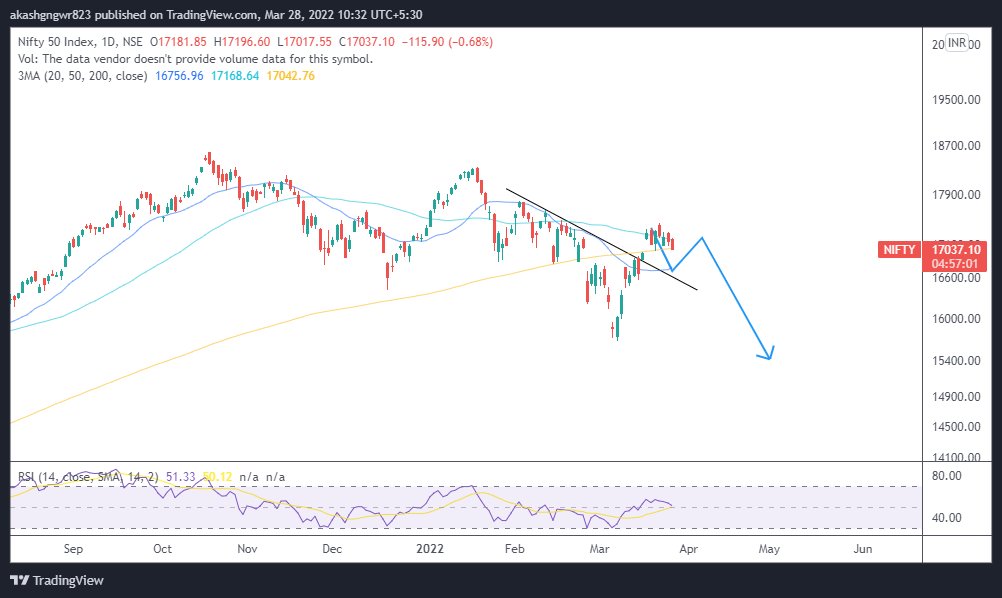
JK bhai let's have fake breakout in Nifty \U0001f61c
— Aakash Gangwar (@akashgngwr823) March 10, 2022
Not joking though, have a reason to anticipate that. https://t.co/idzSRIpWga pic.twitter.com/MNsTm3Mron
More from Aakash Gangwar
1. Long term channel top.
2. Curvature shift of 20 and 50 WMA along with price hitting 20 WMA frequently.
3. Overall weakness in IT sector.
4. For reference, study reliance top in August 2020, study Nasdaq Weekly chart and the top made in Nov 2021.
#tataelxi https://t.co/RmJa5LrdAP
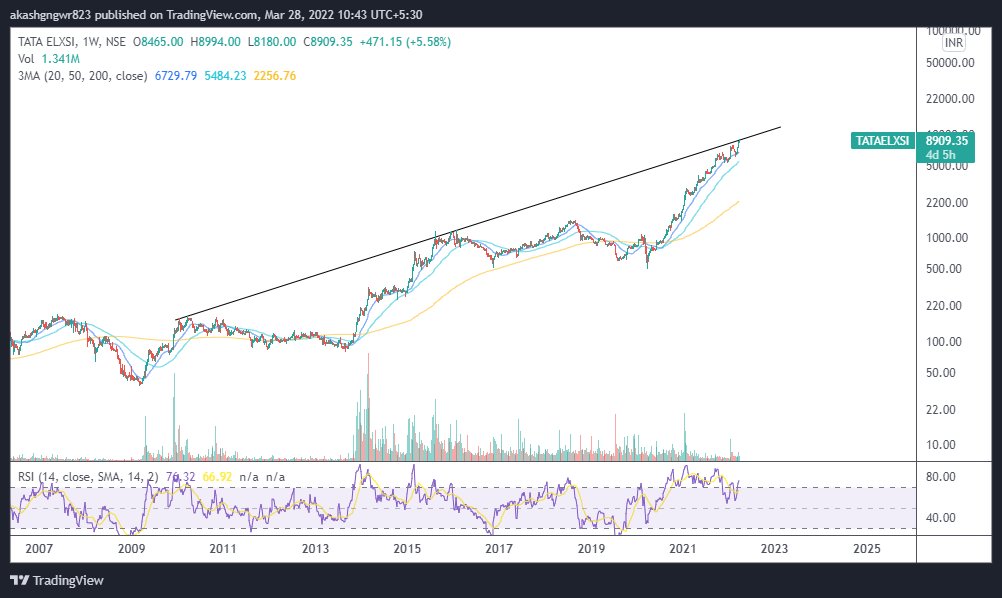
I have traded the current fav Tata Elxi from 2200 to 4500. No regret on missing out rest of the move because I am not an investor. Now there are many technical red flags. I might be trolled but 10.5k looks max target while 5k or 3-4 years of sideways looks inevitable.#tataelxi
— Aakash Gangwar (@akashgngwr823) March 26, 2022
#bearrun
#BearMarket
Head & Shoulders pattern, double top and bearish RSI divergences fail more often in bull market and generally gives a very good SAR trade. Vice versa is also true for bear market.#bullrun #BullMarket
— Aakash Gangwar (@akashgngwr823) February 9, 2021
More from Nifty

Low made 17129.55
Objective 0.382% (17181) #done.
If nifty not sustain above today and high and gap remain gap than more downside open till Fibonacci retracement
0.50%(16893) and 0.618%(16604
#Probability
#NiFTY_50(17475)
— Waves_Perception(Dinesh Patel) \u092e\u0948\u0902Schedule Tribe) (@idineshptl) April 17, 2022
Daily chart and monthly chart.
Dail chart show Fibonacci retracement level 1st 0.236% done.
Next objetive is to test 2nd 0.382%17181 during the entire week and close near to it.#MACD#RSI pic.twitter.com/Bt9bJuHDFh