
In such a case, H&S can be either a continuation pattern or compound fulcrum.
This is how to differentiate:
• if right shoulder is smaller than left, most likely a continuation H&S
• if right is same or higher than left, and the price is not coming to neckline, most likely CF
sir a doubt does head & shoulders work in down trend ? pic.twitter.com/dytYmbzOfp
— Vega_Greek (@VegaGreek) May 13, 2021
More from Piyush Chaudhry


More from Stockslearnings

1 - Accuracy
There is no such thing as 90% Accuracy without compromising on other factors (like profit factor, etc)
Fact - A good trading system will have only 35-60% accuracy without compromising other factors.
(1/n)
2 - Profit Factor (PF)
It is similar to risk-reward. It is derived using the below formula:
Profit Factor = Total Profit by winning trades / Total loss by losing trades
Fact - A trading system above 1.2 PF is good if it scores well with other factors.
(2/n)
3 - Maximum Drawdown
The maximum drawdown also plays a vital role psychologically while picking a trading system.
Fact - Maximum Drawdown in any trading system should not exceed 20%. I suggest picking only the techniques which have less than 10% maximum drawdown.
(3/n)
4 - Maximum Consecutive Losers
We all feel bad even if we lose only Rs.1,000 in a trade. Because it is not only about the money, it is emotionally difficult to accept the failure.
Fact - A good trading system will have less than 15 consecutive losing trades.
(4/n)
TRADE LIKE CRAZY
10 Profitable Intraday Trading Systems, which are backtested against 10-years of Banknifty Historical Data!
(n/n)
https://t.co/BuUie17Ish


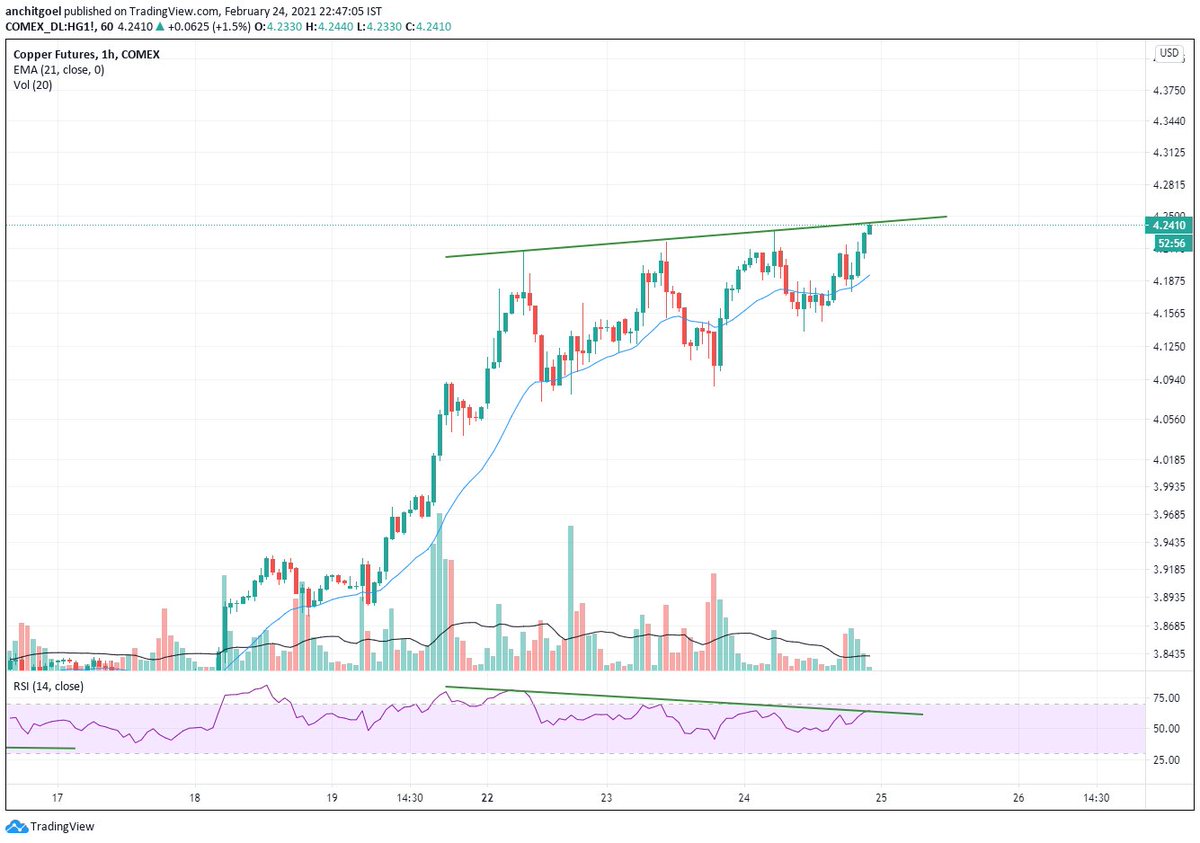
10% more gains to 127.75 !! 🍻🔥🚀
Expecting it to consolidate now in coming days before a final move to 145-150 levels. #Copper RSI is overheated and needs to cool down.
Negative divergence building up on hourly charts. https://t.co/sBU4O6QZsq
#HindCopper
— Anchit Goel (@anchitsays) February 23, 2021
20% Upper Circuit at 118.05 now!! \U0001f389\U0001fa85\U0001f525\U0001f680\U0001f973\U0001f37b\U0001f60d
Conviction and patience has given excellent results. https://t.co/T5y2CBY9Lt pic.twitter.com/xvDeR91PkL


You May Also Like

(I am forced to do this due to continuous hounding of Sikh Extremists since yesterday)
Rani Jindan Kaur, wife of Maharaja Ranjit Singh had illegitimate relations with Lal Singh (PM of Ranjit Singh). Along with Lal Singh, she attacked Jammu, burnt - https://t.co/EfjAq59AyI

Tomorrow again same thing happens bcoz fudus like you are creating a narrative oh Khalistan. when farmers are asking MSP. (RSS ki tatti khane wale Kerni sena ke kutte).
— Ancient Economist (@_stock_tips) December 5, 2020
U kill sikhs in 1984 just politics. To BC low IQ fudu Saale entire history was politics.
Hindu villages of Jasrota, caused rebellion in Jammu, attacked Kishtwar.
Ancestors of Raja Ranjit Singh, The Sansi Tribe used to give daughters as concubines to Jahangir.

The Ludhiana Political Agency (Later NW Fronties Prov) was formed by less than 4000 British soldiers who advanced from Delhi and reached Ludhiana, receiving submissions of all sikh chiefs along the way. The submission of the troops of Raja of Lahore (Ranjit Singh) at Ambala.
Dabistan a contemporary book on Sikh History tells us that Guru Hargobind broke Naina devi Idol Same source describes Guru Hargobind serving a eunuch
YarKhan. (ref was proudly shared by a sikh on twitter)
Gobind Singh followed Bahadur Shah to Deccan to fight for him.

In Zafarnama, Guru Gobind Singh states that the reason he was in conflict with the Hill Rajas was that while they were worshiping idols, while he was an idol-breaker.
And idiot Hindus place him along Maharana, Prithviraj and Shivaji as saviours of Dharma.


Covering one of the most unique set ups: Extended moves & Reversal plays
Time for a 🧵 to learn the above from @iManasArora
What qualifies for an extended move?
30-40% move in just 5-6 days is one example of extended move
How Manas used this info to book
The stock exploded & went up as much as 63% from my price.
— Manas Arora (@iManasArora) June 22, 2020
Closed my position entirely today!#BroTip pic.twitter.com/CRbQh3kvMM
Post that the plight of the
What an extended (away from averages) move looks like!!
— Manas Arora (@iManasArora) June 24, 2020
If you don't learn to sell into strength, be ready to give away the majority of your gains.#GLENMARK pic.twitter.com/5DsRTUaGO2
Example 2: Booking profits when the stock is extended from 10WMA
10WMA =
#HIKAL
— Manas Arora (@iManasArora) July 2, 2021
Closed remaining at 560
Reason: It is 40+% from 10wma. Super extended
Total revenue: 11R * 0.25 (size) = 2.75% on portfolio
Trade closed pic.twitter.com/YDDvhz8swT
Another hack to identify extended move in a stock:
Too many green days!
Read
When you see 15 green weeks in a row, that's the end of the move. *Extended*
— Manas Arora (@iManasArora) August 26, 2019
Simple price action analysis.#Seamecltd https://t.co/gR9xzgeb9K
