#HDFCBANK - More than a decade long Channel.

More from Piyush Chaudhry
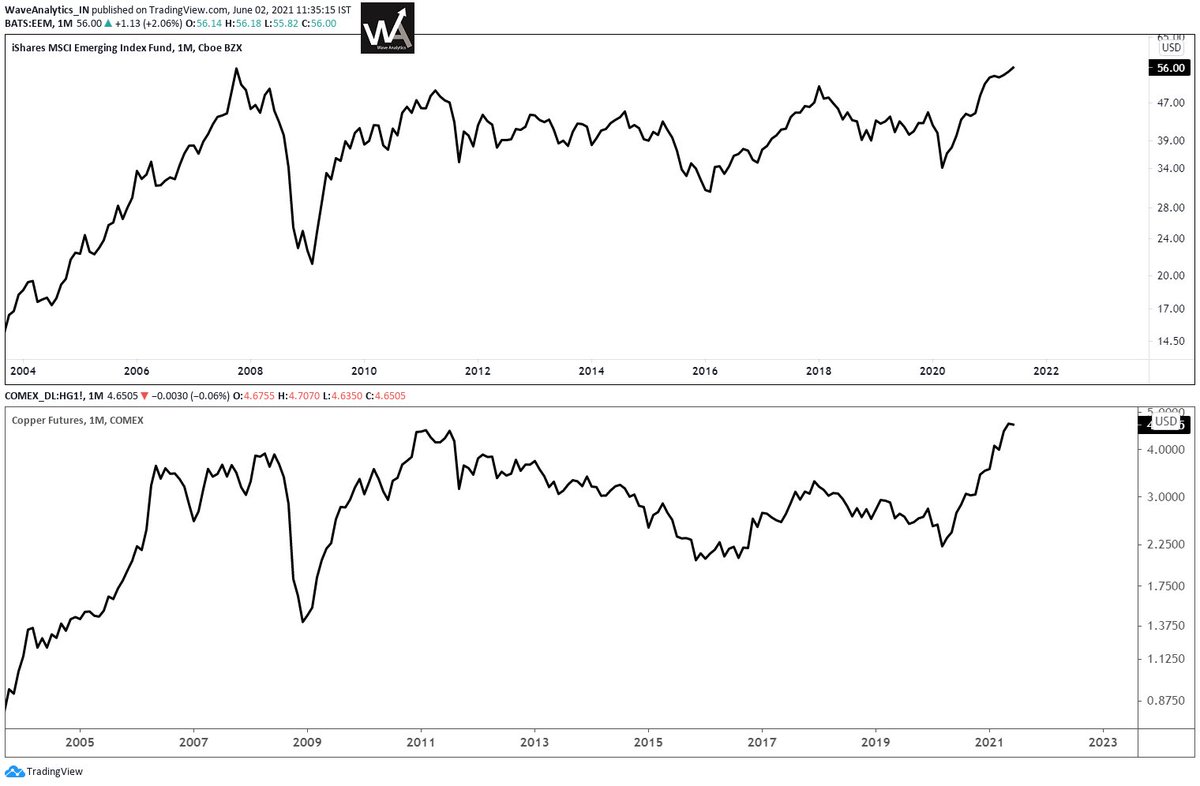
In such a case, H&S can be either a continuation pattern or compound fulcrum.
This is how to differentiate:
• if right shoulder is smaller than left, most likely a continuation H&S
• if right is same or higher than left, and the price is not coming to neckline, most likely CF
This is how to differentiate:
• if right shoulder is smaller than left, most likely a continuation H&S
• if right is same or higher than left, and the price is not coming to neckline, most likely CF
sir a doubt does head & shoulders work in down trend ? pic.twitter.com/dytYmbzOfp
— Vega_Greek (@VegaGreek) May 13, 2021

When everyone got tired, Lever woke up!
New All Time High.
#HINDUNILVR
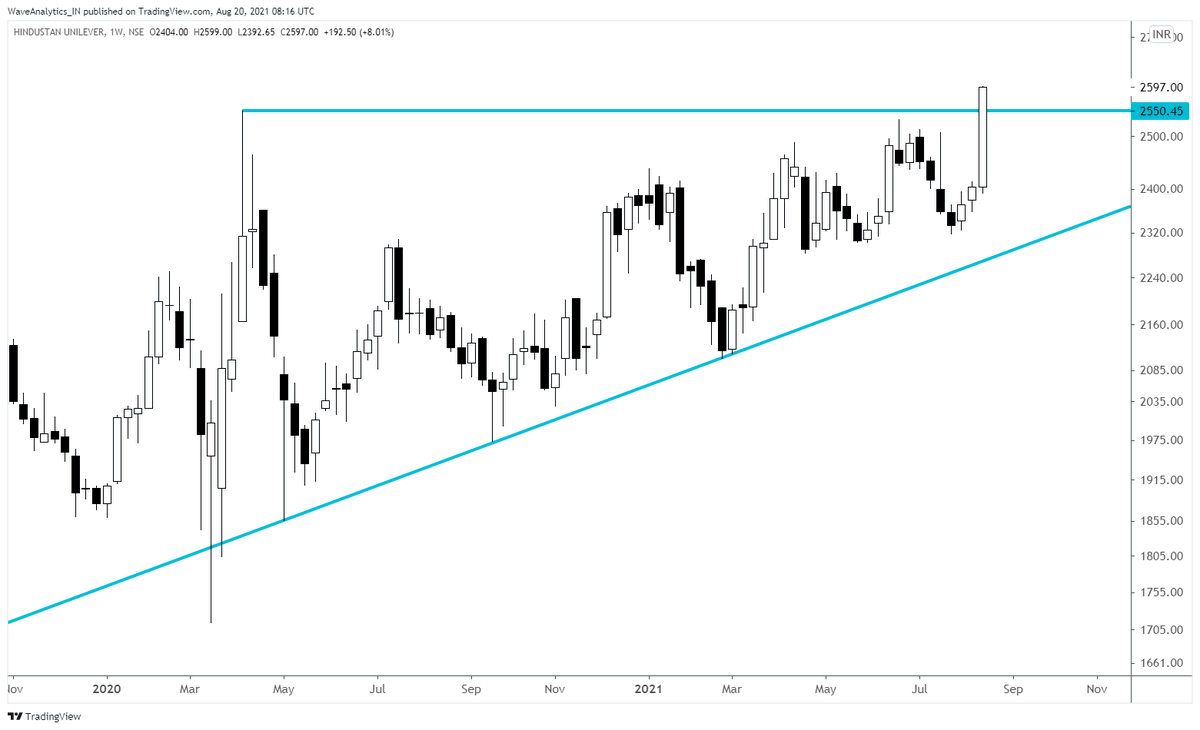
EW
as per relative strength
New All Time High.
#HINDUNILVR
EW
Long Term Chart of the Month. #HINDUNILVR
— Piyush Chaudhry (@piyushchaudhry) December 9, 2020
Sometime in the next decade I see a fair possibility of stock reaching 7000 odd.
Invalidation below Blue Trendline. #ElliottWave pic.twitter.com/uxQrzt1mbj
as per relative strength
One question that I often get is which of the two: #HINDUNILVR or #ITC would be a better Investment bet. While their individual charts are clear themselves, another approach is ratio chart. IMHO Lever should outperform ITC for several years going forward.https://t.co/3AFqm6FJ1Q pic.twitter.com/rLuIm8xyVw
— Piyush Chaudhry (@piyushchaudhry) December 30, 2020
You May Also Like

On the occasion of youtube 20k and Twitter 70k members
A small tribute/gift to members
Screeners
technical screeners - intraday and positional both
before proceeding - i have helped you , can i ask you so that it can help someone else too
thank you
positional one
run - find #stock - draw chart - find levels
1- Stocks closing daily 2% up from 5 days
https://t.co/gTZrYY3Nht
2- Weekly breakout
https://t.co/1f4ahEolYB
3- Breakouts in short term
https://t.co/BI4h0CdgO2
4- Bullish from last 5
intraday screeners
5- 15 minute Stock Breakouts
https://t.co/9eAo82iuNv
6- Intraday Buying seen in the past 15 minutes
https://t.co/XqAJKhLB5G
7- Stocks trading near day's high on 5 min chart with volume BO intraday
https://t.co/flHmm6QXmo
Thank you
A small tribute/gift to members
Screeners
technical screeners - intraday and positional both
before proceeding - i have helped you , can i ask you so that it can help someone else too
thank you
positional one
run - find #stock - draw chart - find levels
1- Stocks closing daily 2% up from 5 days
https://t.co/gTZrYY3Nht
2- Weekly breakout
https://t.co/1f4ahEolYB
3- Breakouts in short term
https://t.co/BI4h0CdgO2
4- Bullish from last 5
intraday screeners
5- 15 minute Stock Breakouts
https://t.co/9eAo82iuNv
6- Intraday Buying seen in the past 15 minutes
https://t.co/XqAJKhLB5G
7- Stocks trading near day's high on 5 min chart with volume BO intraday
https://t.co/flHmm6QXmo
Thank you