
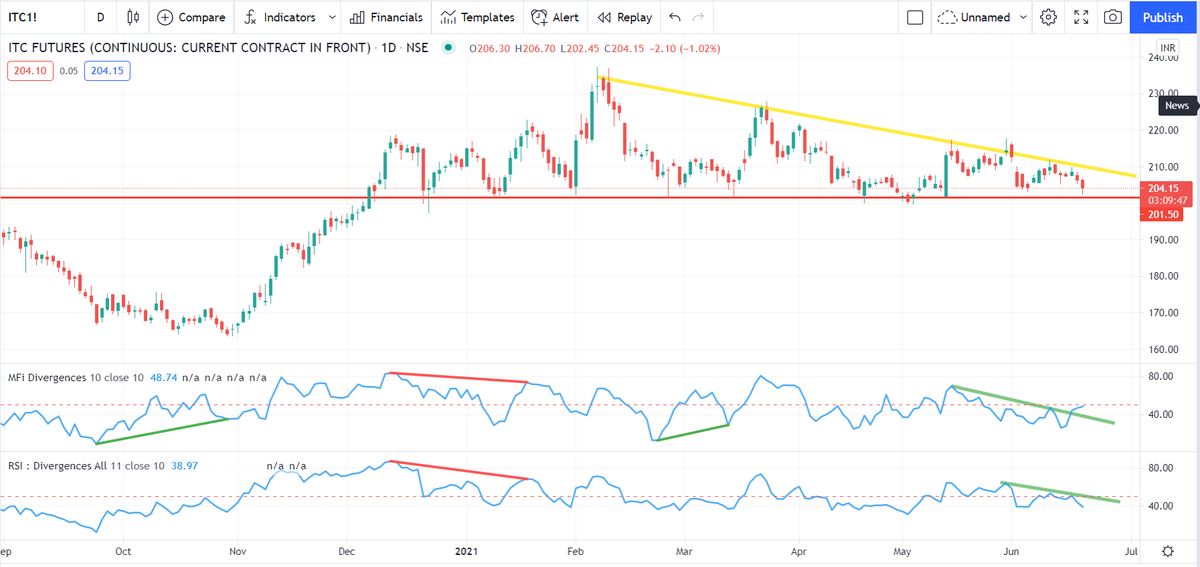
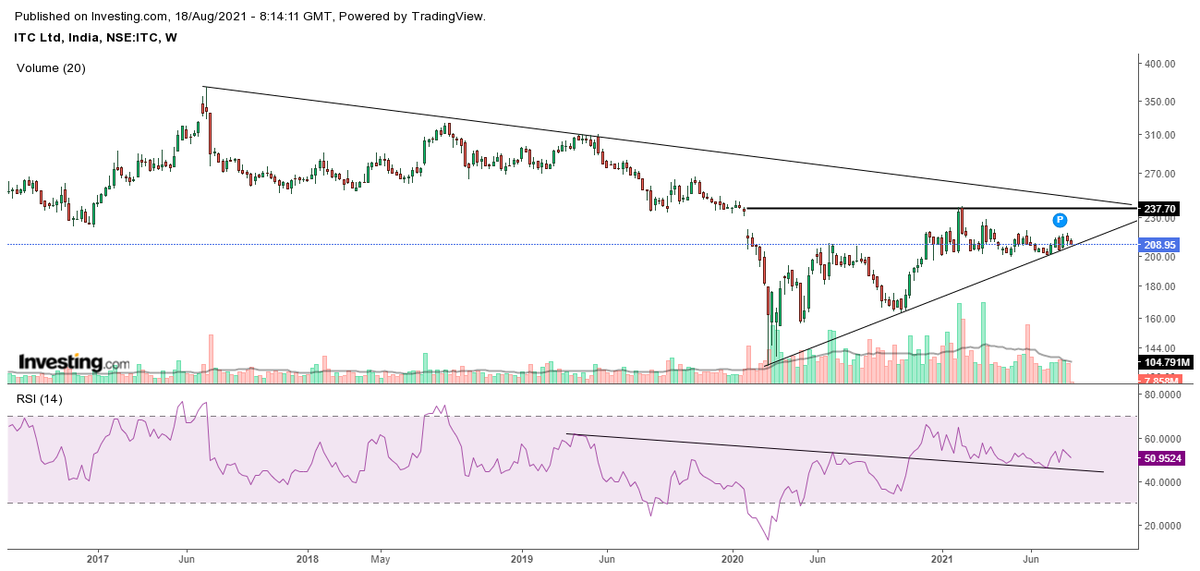
Since lot of discussions on ITC, had a simple look at the chart. With each passing day, the probability of a large breakout increases. Watch the behaviour of MFI, but wait for prices to trade above the trendline with volumes
More from Subhadip Nandy
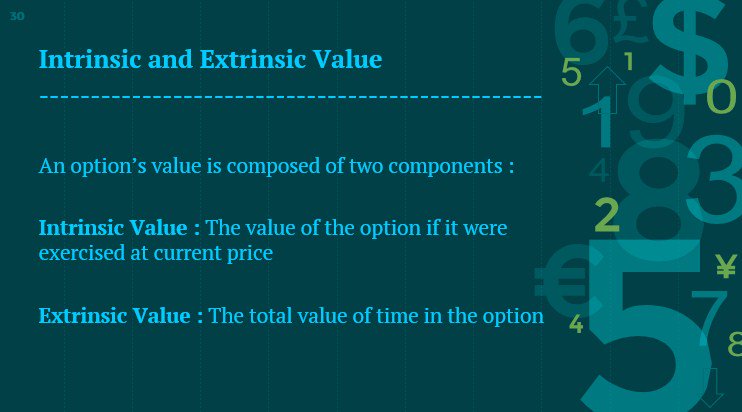
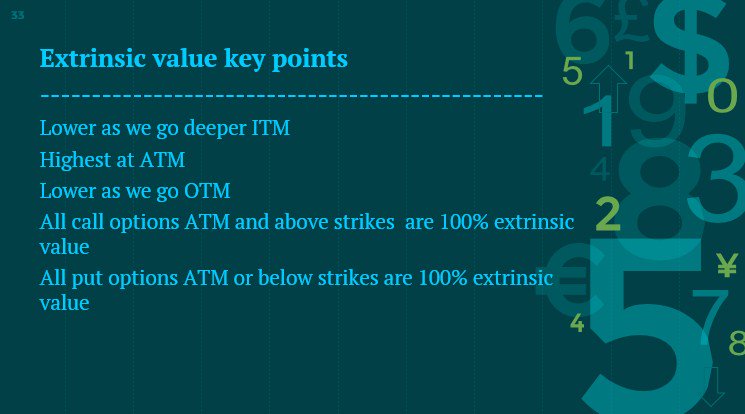
This friend had trouble making money in options though he was directionally right. Let us see how a basic understanding of greeks would have helped him, This thread will be about two attributes of option pricing, extrinsic value and theta
An option has two parts, intrinsic and extrinsic value. Think of a pack of Lay's potato chips. When you buy and open the pack, what you find is some chips and a lot of air. Intrinsic value is the chips, extrinsic value is air
https://t.co/8ZPv4ZnCiL
https://t.co/icWmqSLENW
https://t.co/vHA6azEmbQ
Sir, today #niftybank was continue making new high, but 31700 CE was struggling to go up. I bought at 140, some how managed to sell it at 200. I m ok, in identifying directional edge but options behave differently.
— Vikash Shrivastava\U0001f1ee\U0001f1f3 (@VikashS28) May 27, 2019
An option has two parts, intrinsic and extrinsic value. Think of a pack of Lay's potato chips. When you buy and open the pack, what you find is some chips and a lot of air. Intrinsic value is the chips, extrinsic value is air
https://t.co/8ZPv4ZnCiL
https://t.co/icWmqSLENW
https://t.co/vHA6azEmbQ
Study this thread and then check the VIX charts and Nifty charts from 1st Oct 2018. There is a reason I am retweeting this now :)
1. IV > HV
— Subhadip Nandy (@SubhadipNandy16) October 5, 2018
2. High IVR
3. Sell strangles 2SD away
This is the crux of all complicated option selling strategies . Nothing so simple can work across all market conditions .
More from Itc


You May Also Like


I just finished Eric Adler's The Battle of the Classics, and wanted to say something about Joel Christiansen's review linked below. I am not sure what motivates the review (I speculate a bit below), but it gives a very misleading impression of the book. 1/x
The meat of the criticism is that the history Adler gives is insufficiently critical. Adler describes a few figures who had a great influence on how the modern US university was formed. It's certainly critical: it focuses on the social Darwinism of these figures. 2/x
Other insinuations and suggestions in the review seem wildly off the mark, distorted, or inappropriate-- for example, that the book is clickbaity (it is scholarly) or conservative (hardly) or connected to the events at the Capitol (give me a break). 3/x
The core question: in what sense is classics inherently racist? Classics is old. On Adler's account, it begins in ancient Rome and is revived in the Renaissance. Slavery (Christiansen's primary concern) is also very old. Let's say classics is an education for slaveowners. 4/x
It's worth remembering that literacy itself is elite throughout most of this history. Literacy is, then, also the education of slaveowners. We can honor oral and musical traditions without denying that literacy is, generally, good. 5/x
As someone\u2019s who\u2019s read the book, this review strikes me as tremendously unfair. It mostly faults Adler for not writing the book the reviewer wishes he had! https://t.co/pqpt5Ziivj
— Teresa M. Bejan (@tmbejan) January 12, 2021
The meat of the criticism is that the history Adler gives is insufficiently critical. Adler describes a few figures who had a great influence on how the modern US university was formed. It's certainly critical: it focuses on the social Darwinism of these figures. 2/x
Other insinuations and suggestions in the review seem wildly off the mark, distorted, or inappropriate-- for example, that the book is clickbaity (it is scholarly) or conservative (hardly) or connected to the events at the Capitol (give me a break). 3/x
The core question: in what sense is classics inherently racist? Classics is old. On Adler's account, it begins in ancient Rome and is revived in the Renaissance. Slavery (Christiansen's primary concern) is also very old. Let's say classics is an education for slaveowners. 4/x
It's worth remembering that literacy itself is elite throughout most of this history. Literacy is, then, also the education of slaveowners. We can honor oral and musical traditions without denying that literacy is, generally, good. 5/x
