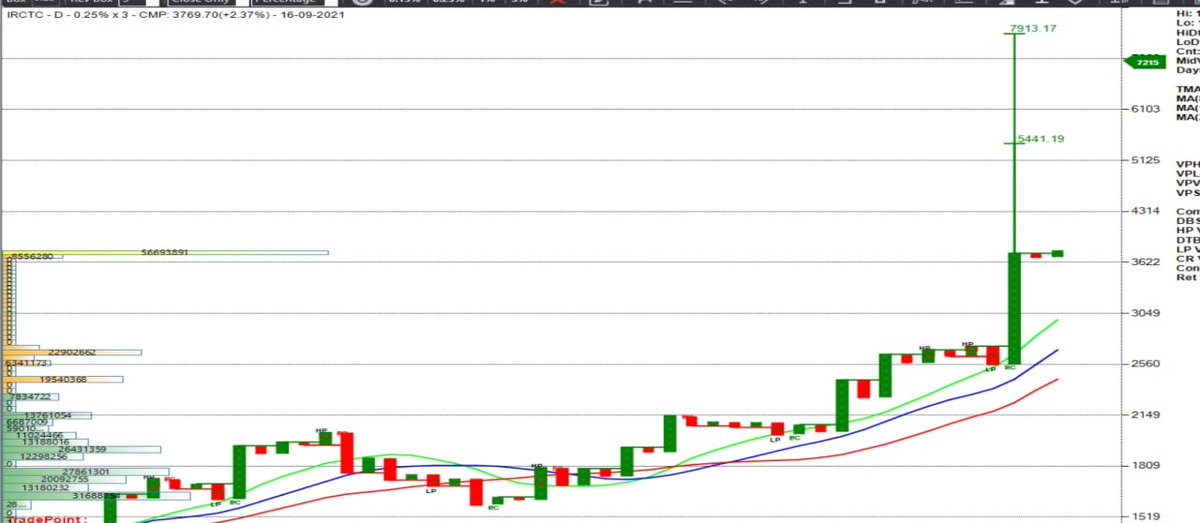
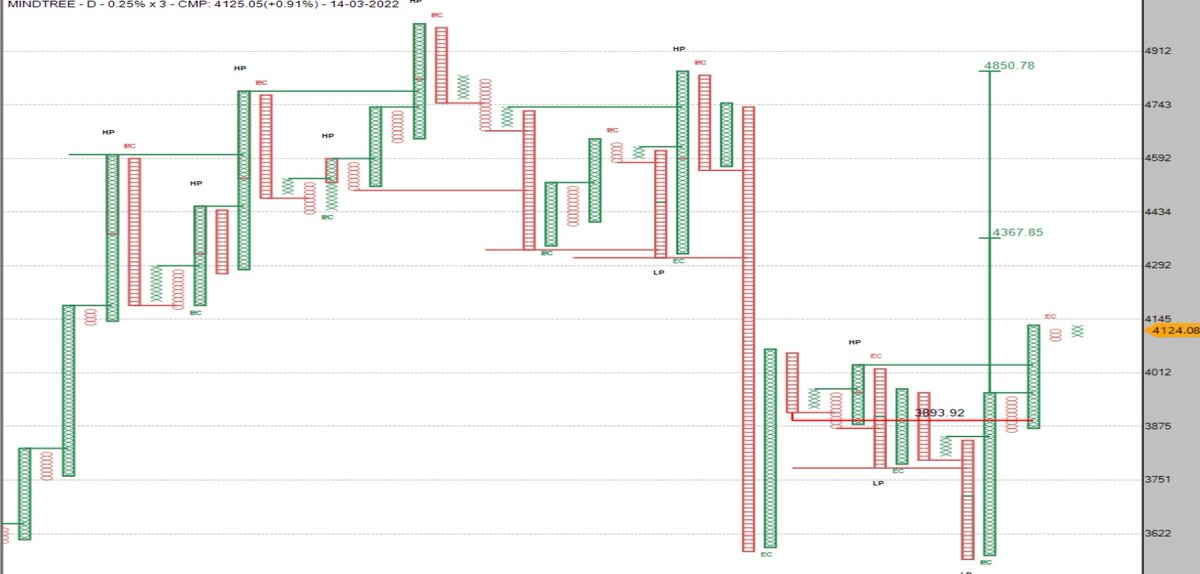
#IRCTC still looks very strong til it closes above 3676, cmp 3769. Can test 5441
More from Abhishek
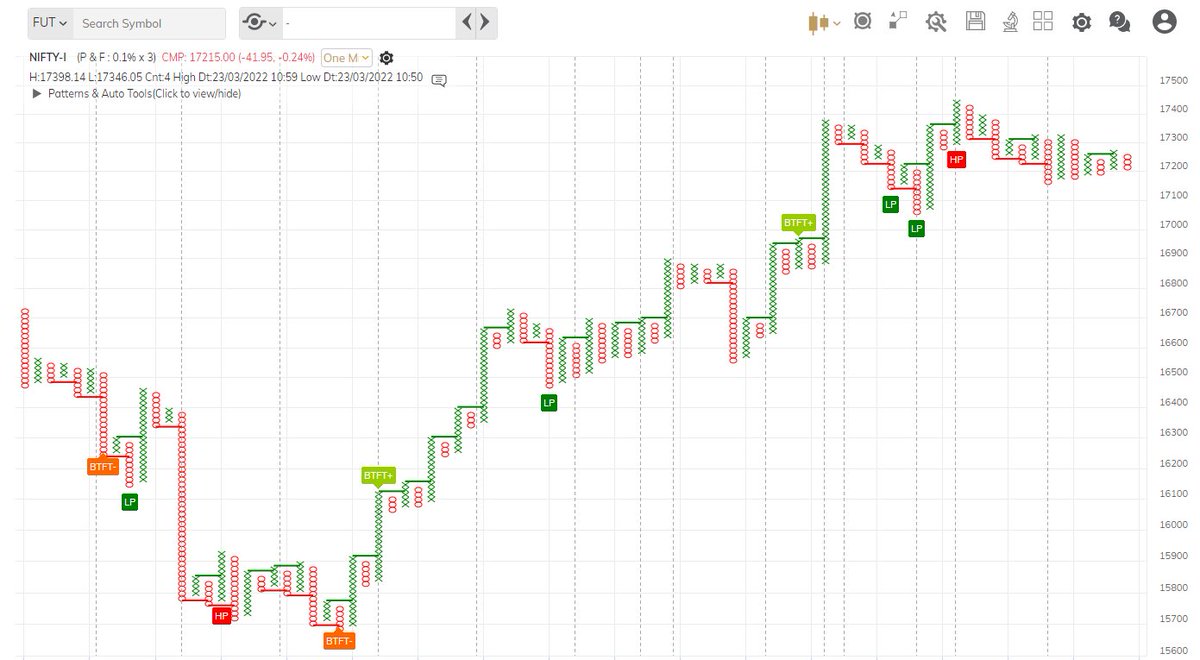
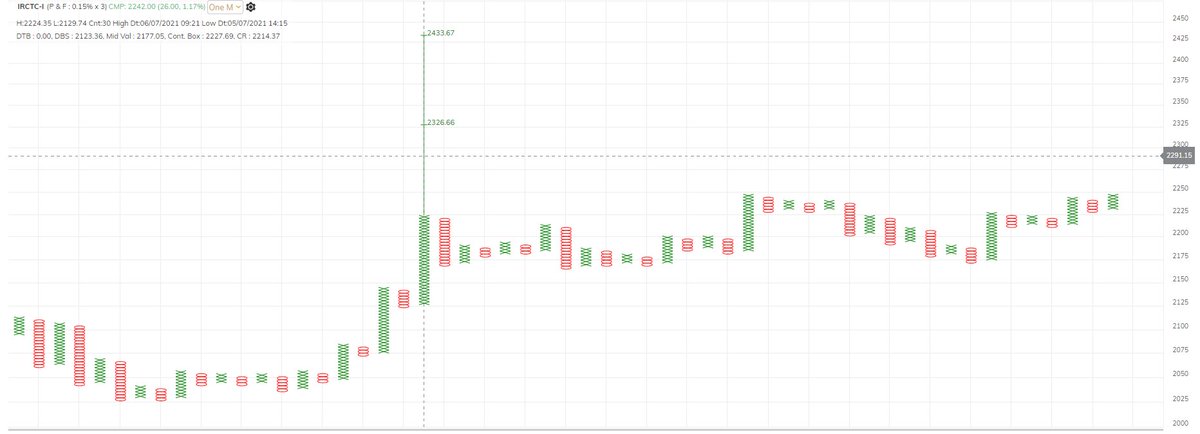
Nifty Futures Positional Trading Using Point & Figure Charts
Following this system on stocks since 2021 and started on Index in 2022
Based on Richard Dennis's Turtle Trading System and the P&F version was created by @Prashantshah267
Details
Chart Settings
Instrument: Nifty Futures ( Current Month)
Chart : Point & Figure
Box Size: 0.10%
Reversal Box: 3
Data Frequency- 1 Min
P&F Charts don't have concept of time but it has a concept Data Frequency, i.e. duration after which to consider plotting X or O on the chart
Since DF is 1 Min here, so we need to wait for 1 Min closing on P&F Charts for Entry, Exit Signals
The chart is an Intraday Chart & requires Intraday data
Which is available on the Real Time Tradepoint Software & on the Web Version of this software
https://t.co/oAshC7rfD1
-
Let's now Discuss Bullish Entry Pattern
The Entry Pattern is called as a Bullish Follow Through Turtle Buy Pattern
This actually comprises of 2 Parts
1. Bullish Turtle Breakout
2. Bullish Turtle Follow Through
For Entry, #1 must happen and there must be a #2 immediately
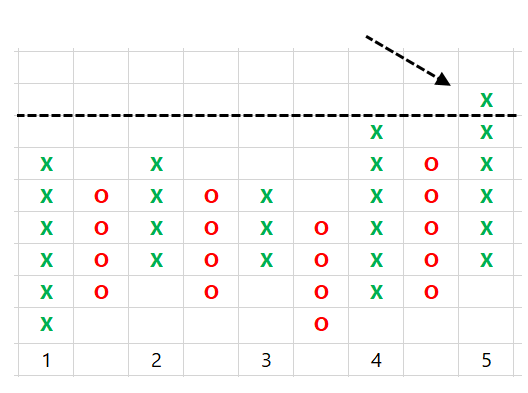
First Let's Understand the Bullish Turtle Breakout Pattern
This is a 5 X BO Pattern
If current column of X goes above highest ‘X’ in last 5 columns (including current column), then it is a 5-X Turtle breakout.
Following this system on stocks since 2021 and started on Index in 2022
Based on Richard Dennis's Turtle Trading System and the P&F version was created by @Prashantshah267
Details
Chart Settings
Instrument: Nifty Futures ( Current Month)
Chart : Point & Figure
Box Size: 0.10%
Reversal Box: 3
Data Frequency- 1 Min
P&F Charts don't have concept of time but it has a concept Data Frequency, i.e. duration after which to consider plotting X or O on the chart
Since DF is 1 Min here, so we need to wait for 1 Min closing on P&F Charts for Entry, Exit Signals
The chart is an Intraday Chart & requires Intraday data
Which is available on the Real Time Tradepoint Software & on the Web Version of this software
https://t.co/oAshC7rfD1
-
Let's now Discuss Bullish Entry Pattern
The Entry Pattern is called as a Bullish Follow Through Turtle Buy Pattern
This actually comprises of 2 Parts
1. Bullish Turtle Breakout
2. Bullish Turtle Follow Through
For Entry, #1 must happen and there must be a #2 immediately
First Let's Understand the Bullish Turtle Breakout Pattern
This is a 5 X BO Pattern
If current column of X goes above highest ‘X’ in last 5 columns (including current column), then it is a 5-X Turtle breakout.


More from Irctc


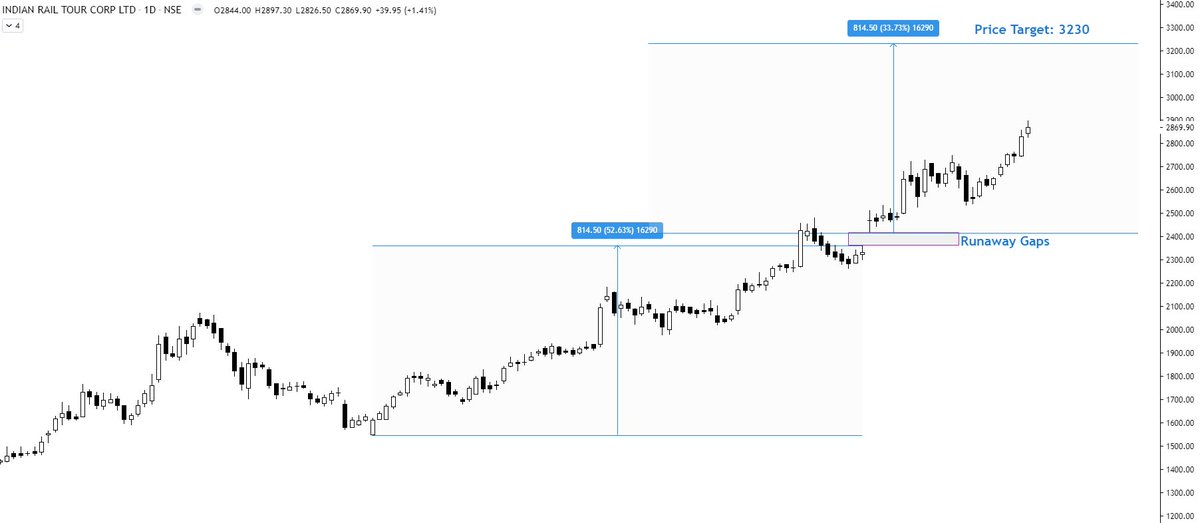
IRCTC - Learning?
Runaway Gaps are traded like flag & pennant patterns. The price move before the gap is projected upwards for the price target. Here the target comes out to be 3230. https://t.co/QuKrekfHG3
Runaway Gaps are traded like flag & pennant patterns. The price move before the gap is projected upwards for the price target. Here the target comes out to be 3230. https://t.co/QuKrekfHG3
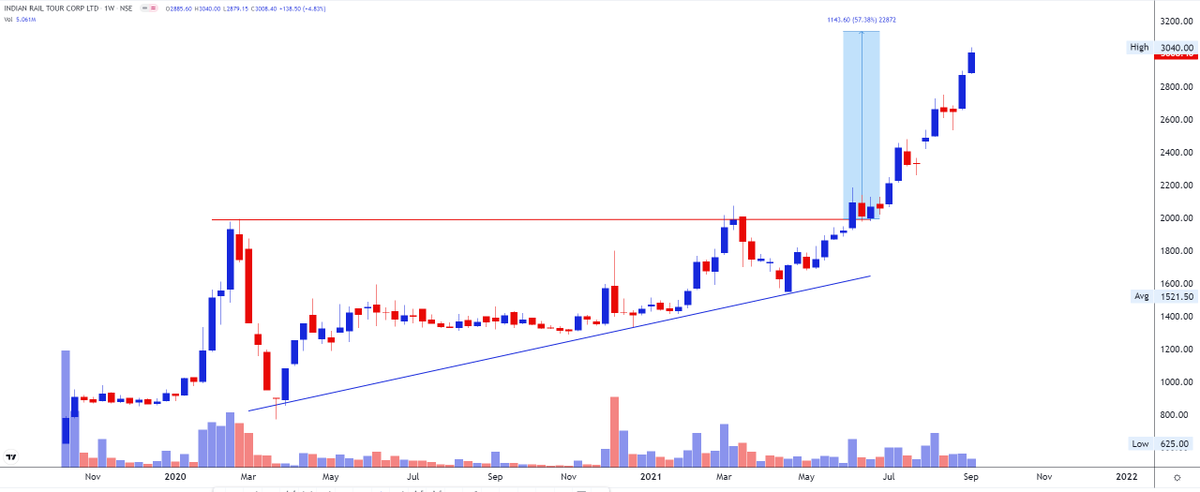
IRCTC - A perfect pullback on low volumes after a high volume breakout. Low-risk setup. Weak below 2015 pic.twitter.com/jSHBlEhkE0
— The_Chartist \U0001f4c8 (@nison_steve) June 9, 2021

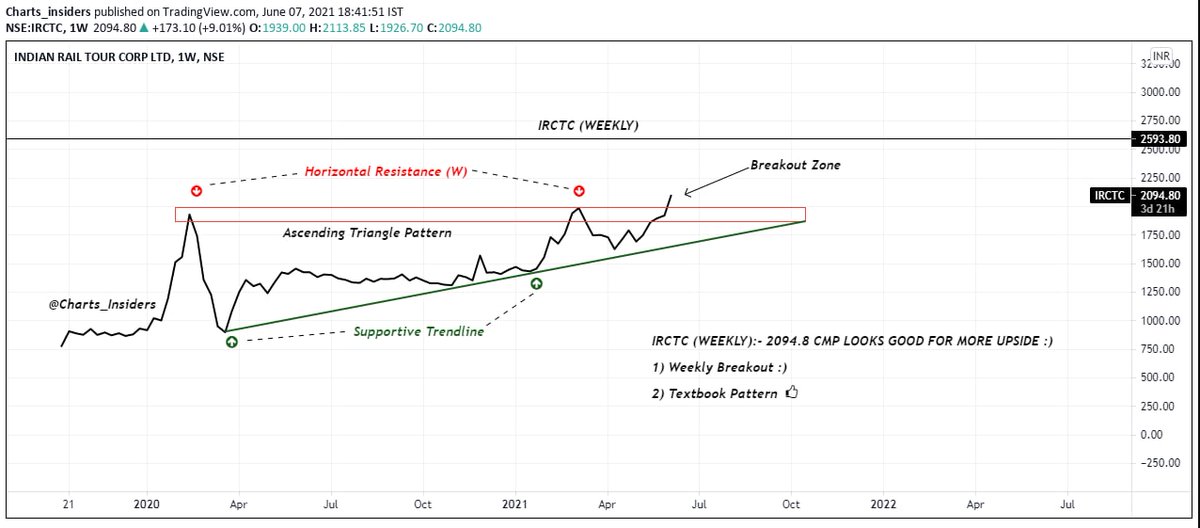
NSE:IRCTC 3040
1. Still 200/400 point movement left as per Ascending Triangle Pattern.
2. Stock perfectly moved according to the classic pattern.
3. Next level to watch now 3500-4000
4. Support near 2600-2800 https://t.co/VrUhS85Rml
1. Still 200/400 point movement left as per Ascending Triangle Pattern.
2. Stock perfectly moved according to the classic pattern.
3. Next level to watch now 3500-4000
4. Support near 2600-2800 https://t.co/VrUhS85Rml
NSE:IRCTC 1775 +2.78%
— Mr. Chartist (@Mr_Chartist) February 26, 2021
-Cup and Handle breakout
-Support at 1600/1650
-Next levels at 1900/2000/2100++#TA pic.twitter.com/LxpPTI0rB6