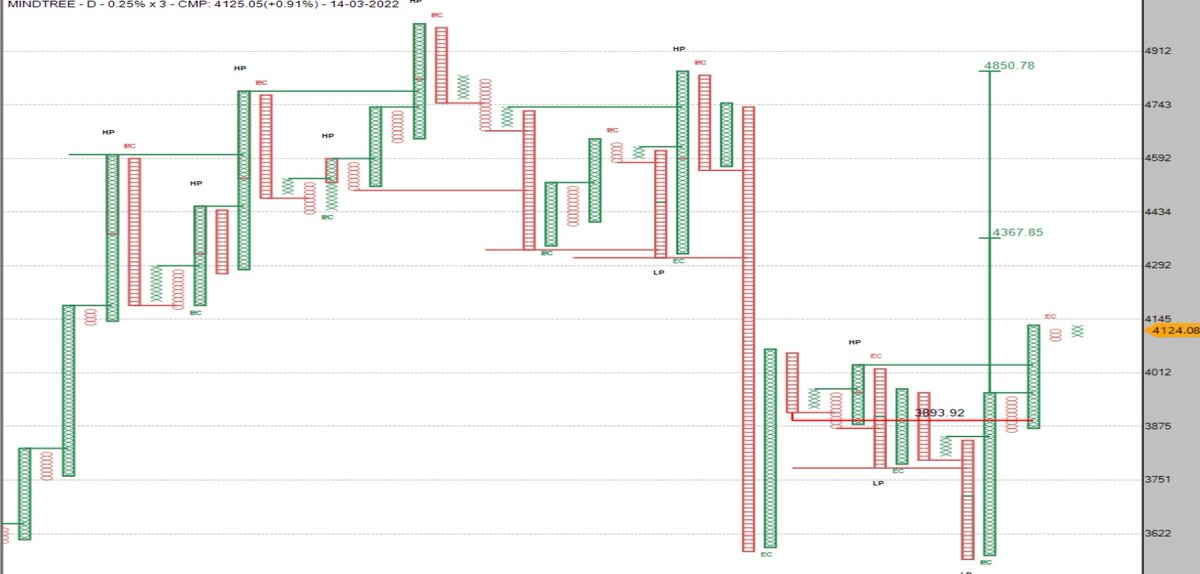
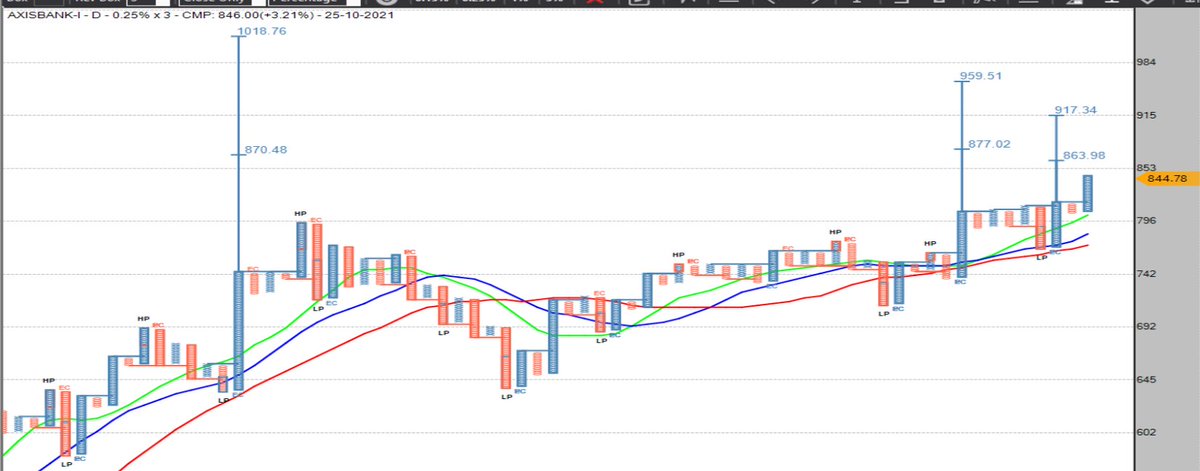
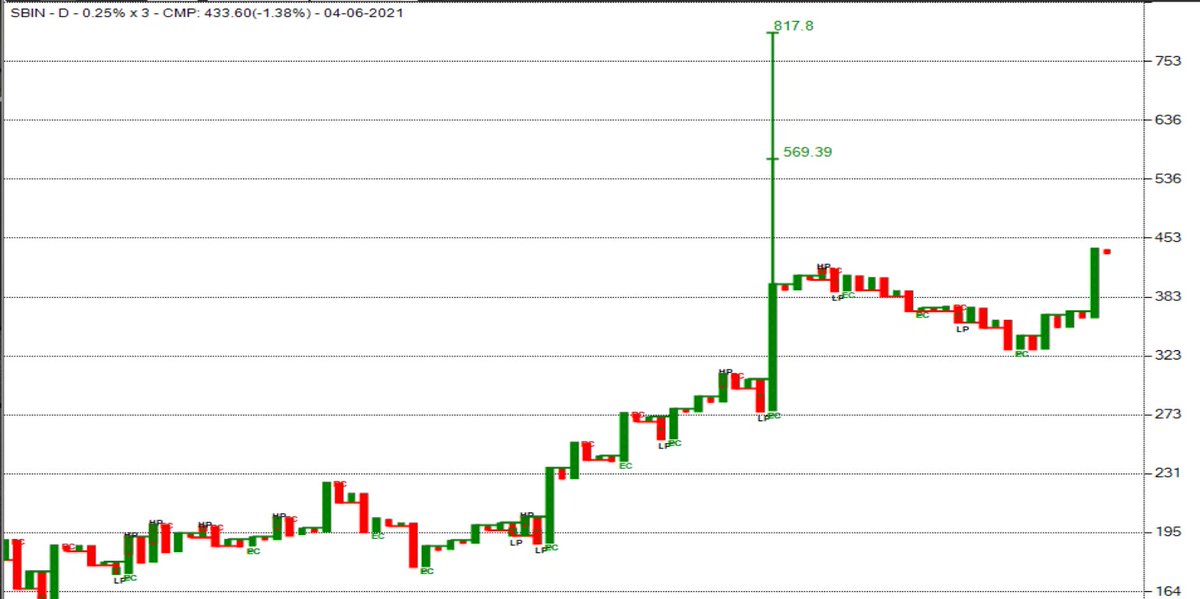
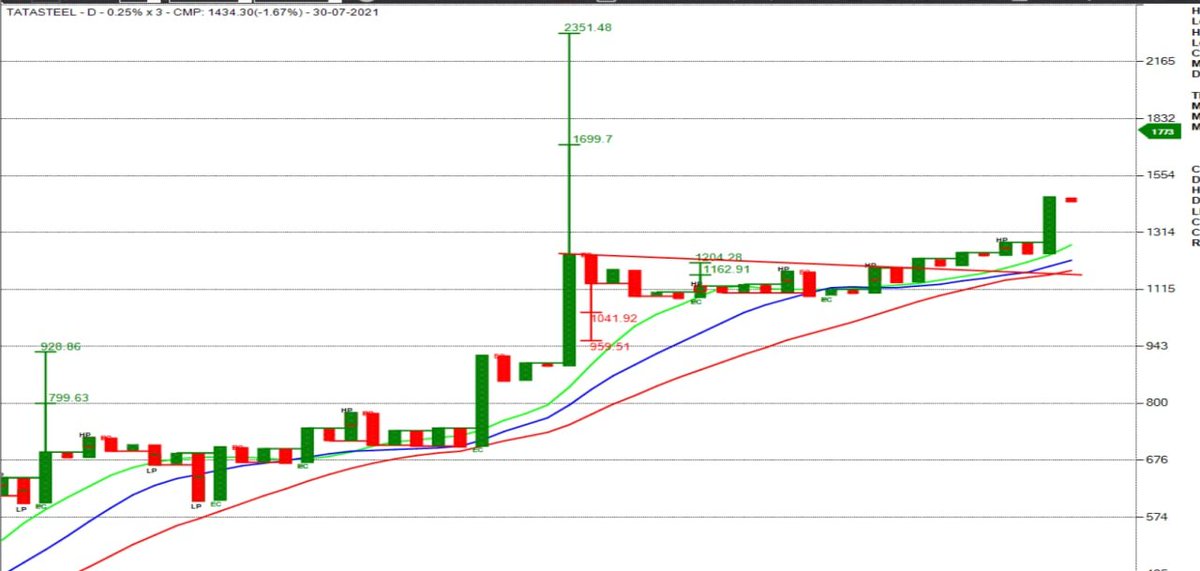
HCL looks very good for long term if it manages to close above 1070.
Cmp 1039.
Negation: 896.
Vertical count 1877
More from Abhishek
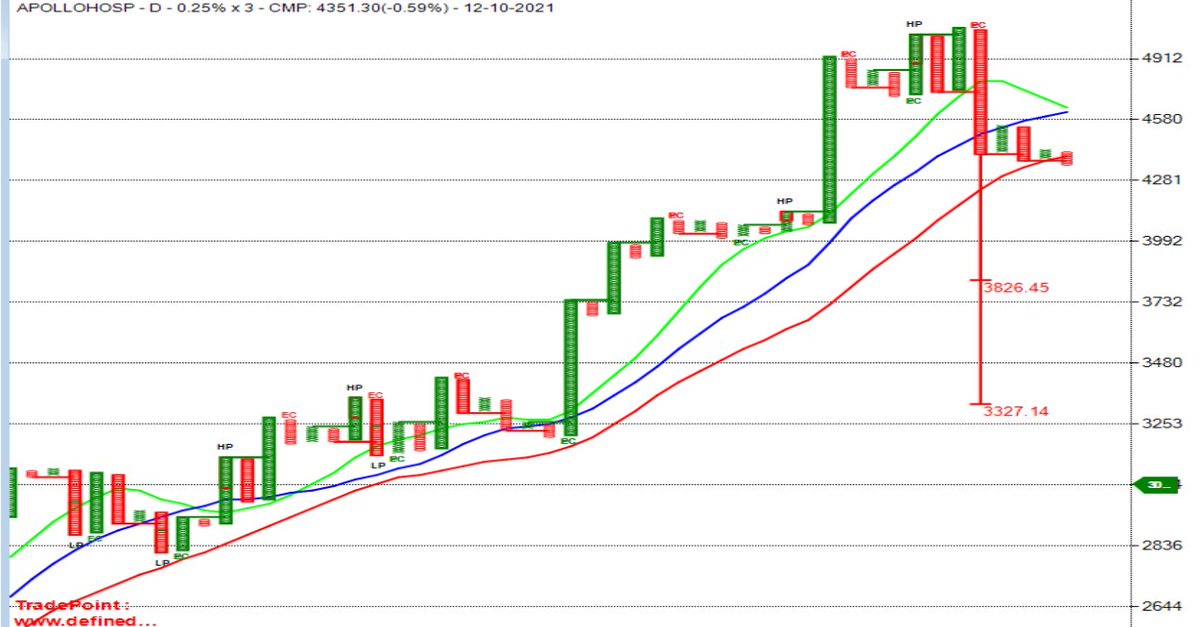
Nifty Futures Positional Trading Using Point & Figure Charts
Following this system on stocks since 2021 and started on Index in 2022
Based on Richard Dennis's Turtle Trading System and the P&F version was created by @Prashantshah267
Details
Chart Settings
Instrument: Nifty Futures ( Current Month)
Chart : Point & Figure
Box Size: 0.10%
Reversal Box: 3
Data Frequency- 1 Min
P&F Charts don't have concept of time but it has a concept Data Frequency, i.e. duration after which to consider plotting X or O on the chart
Since DF is 1 Min here, so we need to wait for 1 Min closing on P&F Charts for Entry, Exit Signals
The chart is an Intraday Chart & requires Intraday data
Which is available on the Real Time Tradepoint Software & on the Web Version of this software
https://t.co/oAshC7rfD1
-
Let's now Discuss Bullish Entry Pattern
The Entry Pattern is called as a Bullish Follow Through Turtle Buy Pattern
This actually comprises of 2 Parts
1. Bullish Turtle Breakout
2. Bullish Turtle Follow Through
For Entry, #1 must happen and there must be a #2 immediately
First Let's Understand the Bullish Turtle Breakout Pattern
This is a 5 X BO Pattern
If current column of X goes above highest ‘X’ in last 5 columns (including current column), then it is a 5-X Turtle breakout.
Following this system on stocks since 2021 and started on Index in 2022
Based on Richard Dennis's Turtle Trading System and the P&F version was created by @Prashantshah267
Details
Chart Settings
Instrument: Nifty Futures ( Current Month)
Chart : Point & Figure
Box Size: 0.10%
Reversal Box: 3
Data Frequency- 1 Min
P&F Charts don't have concept of time but it has a concept Data Frequency, i.e. duration after which to consider plotting X or O on the chart
Since DF is 1 Min here, so we need to wait for 1 Min closing on P&F Charts for Entry, Exit Signals
The chart is an Intraday Chart & requires Intraday data
Which is available on the Real Time Tradepoint Software & on the Web Version of this software
https://t.co/oAshC7rfD1
-
Let's now Discuss Bullish Entry Pattern
The Entry Pattern is called as a Bullish Follow Through Turtle Buy Pattern
This actually comprises of 2 Parts
1. Bullish Turtle Breakout
2. Bullish Turtle Follow Through
For Entry, #1 must happen and there must be a #2 immediately
First Let's Understand the Bullish Turtle Breakout Pattern
This is a 5 X BO Pattern
If current column of X goes above highest ‘X’ in last 5 columns (including current column), then it is a 5-X Turtle breakout.
You May Also Like
A list of cool websites you might now know about
A thread 🧵
1) Learn Anything - Search tools for knowledge discovery that helps you understand any topic through the most efficient
2) Grad Speeches - Discover the best commencement speeches.
This website is made by me
3) What does the Internet Think - Find out what the internet thinks about anything
4) https://t.co/vuhT6jVItx - Send notes that will self-destruct after being read.
A thread 🧵
1) Learn Anything - Search tools for knowledge discovery that helps you understand any topic through the most efficient
2) Grad Speeches - Discover the best commencement speeches.
This website is made by me
3) What does the Internet Think - Find out what the internet thinks about anything
4) https://t.co/vuhT6jVItx - Send notes that will self-destruct after being read.