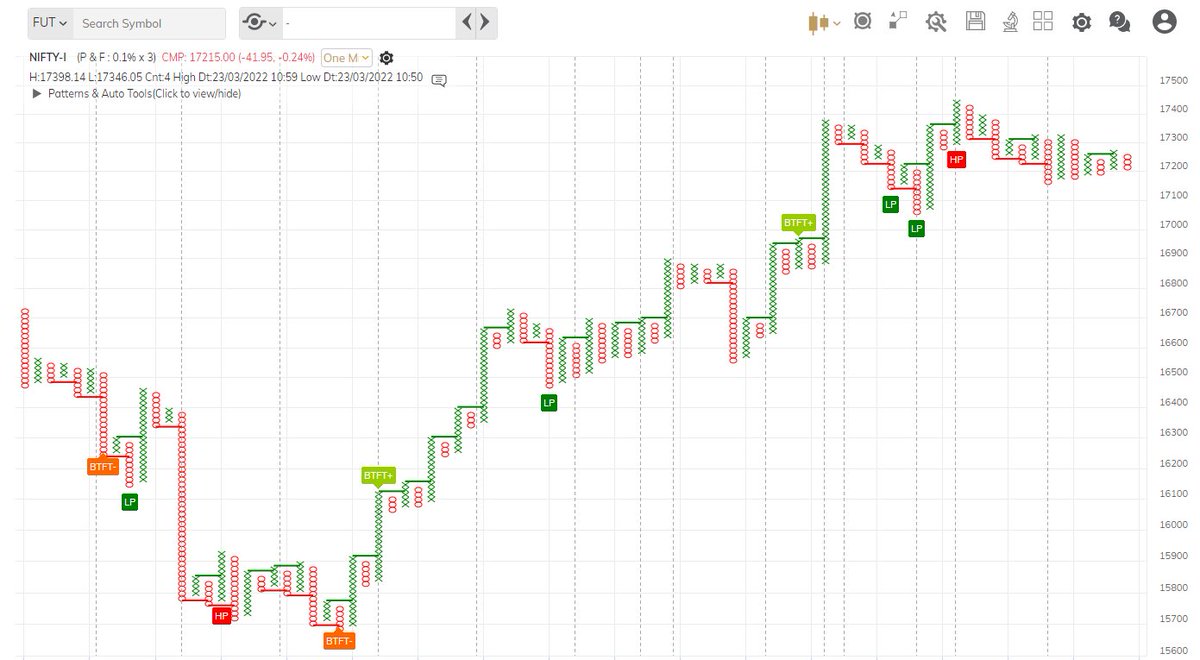
Chart Settings
Instrument: Nifty Futures ( Current Month)
Chart : Point & Figure
Box Size: 0.10%
Reversal Box: 3
Data Frequency- 1 Min
P&F Charts don't have concept of time but it has a concept Data Frequency, i.e. duration after which to consider plotting X or O on the chart
Since DF is 1 Min here, so we need to wait for 1 Min closing on P&F Charts for Entry, Exit Signals
The chart is an Intraday Chart & requires Intraday data
Which is available on the Real Time Tradepoint Software & on the Web Version of this software
https://t.co/oAshC7rfD1 -
Let's now Discuss Bullish Entry Pattern
The Entry Pattern is called as a Bullish Follow Through Turtle Buy Pattern
This actually comprises of 2 Parts
1. Bullish Turtle Breakout
2. Bullish Turtle Follow Through
For Entry, #1 must happen and there must be a #2 immediately
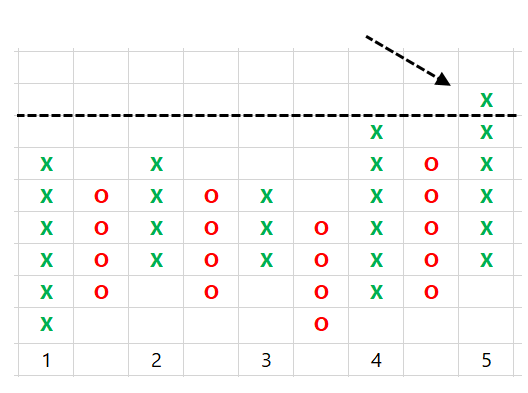
First Let's Understand the Bullish Turtle Breakout Pattern
This is a 5 X BO Pattern
If current column of X goes above highest ‘X’ in last 5 columns (including current column), then it is a 5-X Turtle breakout.
See if you can spot the Bullish Turtle Breakout Pattern on this chart
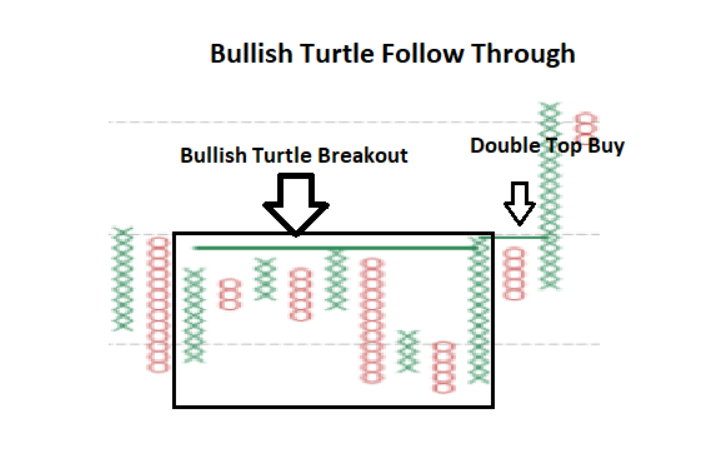
Now let's come to Bullish Turtle Follow Through pattern
This pattern is seen when we get a Double Top Buy pattern immediately after a Bullish Turtle Breakout Pattern
If you are not familiar with Double Top Buy pattern, then its the most primitive Buy pattern in P&F Charts
Here's an example of the Turtle Bullish Follow Through pattern
Which is simply :Double Top Buy Pattern preceded Bullish Turtle Breakout Pattern followed by
Which would look like something Like
Marked all the Turtle Bullish Follow Through patterns on the Chart
One thing to note is that its not mandatory that each
Bullish Turtle Breakout Pattern will result in a Follow Through ( Double Top Buy Immediately after Bullish Turtle Breakout)
It may happen that a Double Top Buy pattern is not formed and in that case we have to avoid the entry
Now that we are clear about Entry, lets talk about Exit
Initial Exit Condition is based on a Single Patterns if either its is formed we must exit the Bullish Trade
Double Bottom Sell
If you are not acquainted with these patterns here's a quick summary
Double Bottom Sell
then its the most primitive Buy pattern in P&F Charts and the opposite of Double Top Buy discussed earlier,
If you understood Double Top Buy Pattern it will be a breeze
Some Examples of Double Bottom Sell
It's Important to know your StopLoss before you Enter a Trade and P&F helps you with this as soon as you decide to place Trade.
So if we Enter into a Bullish Turtle Follow Through, just look for nearest Probable Double Bottom Sell
Example of using Double Bottom Sell as SL during entry
Trailing Stops
Once the Trade becomes In the money, its important to protect profits.
While the Initial SL ( Double Bottom Sell) was useful but if Prices go up fast and one way, then keeping the initial SL as exit trigger would take away all profits.
For Trailing Stops we can use either of the 2 Patterns
1. Double Bottom Sell
2. High Pole
Some Examples of High Pole
Trailing Stops in Bullish Turtle Trade
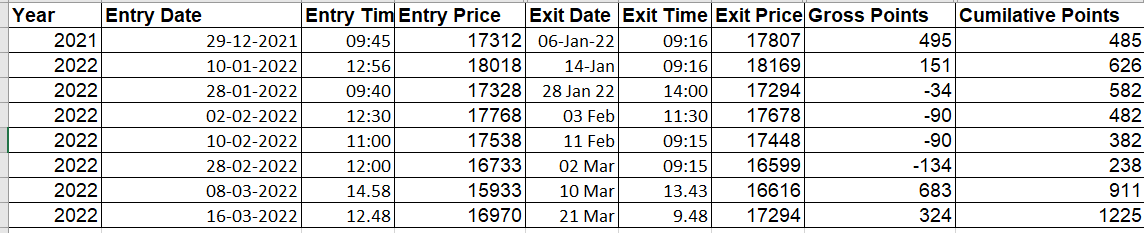
Here are a Few Examples of Entry, Initial SL & Exit
Trade#1
I have marked some of the Long trades since Dec 2021 for understanding
Backtest of this Strategy Since 2011 to 202 Jan ( Long)
This does not Include Slippages, Brokerages
Or consider GapUp or Gap Down scenarios as P&F Charts do not show GapUps or Downs