𝐓𝐡𝐞 𝟓𝟐-𝐖𝐞𝐞𝐤 𝐈𝐧𝐝𝐞𝐱 𝐒𝐜𝐚𝐧𝐧𝐞𝐫 📊
A THREAD 🧵
Please Like & RT this if you find value 🙏
The 52-week index filter on @screener_in is one of the most effective ways to filter out stocks for #equity segment.
Here's how it can help you 👇
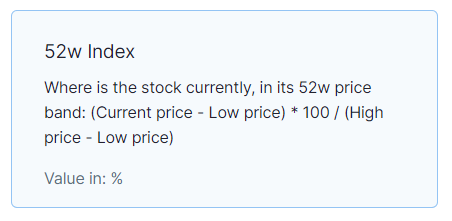
1/ The 52-week index is simply a stock in its 52-week band.
The formula is:
(𝘊𝘶𝘳𝘳𝘦𝘯𝘵 𝘱𝘳𝘪𝘤𝘦 - 𝘓𝘰𝘸 𝘱𝘳𝘪𝘤𝘦) * 100 / (𝘏𝘪𝘨𝘩 𝘱𝘳𝘪𝘤𝘦 - 𝘓𝘰𝘸 𝘱𝘳𝘪𝘤𝘦)
𝗩𝗮𝗹𝘂𝗲 𝗶𝗻 %
2/ Now you may ask what is the 𝟱𝟮-𝘄𝗲𝗲𝗸 𝗯𝗮𝗻𝗱?
Lets understand this with an example -
Take this example of #Birlasoft.
Current Price= ₹531
52-Week High= ₹538
52-Low= ₹216
So, its 𝟱𝟮-𝘄𝗲𝗲𝗸 𝗯𝗮𝗻𝗱 comes at -
= (531-216)/(538-216)*100
= 97.5%
3/ What does this mean?
Basically, we want to look at stocks that are in the top half of their 52-week band (the highlighted area in the diagram) or within 75% of its 𝟱𝟮-𝘄𝗲𝗲𝗸 𝗯𝗮𝗻𝗱.
4/ The main reason we want to select these stocks are because we want stocks wherein the demand is more than its supply.
A stock within its 52-week band means that buyers are still activated here. This simply shortens our filtering process.