
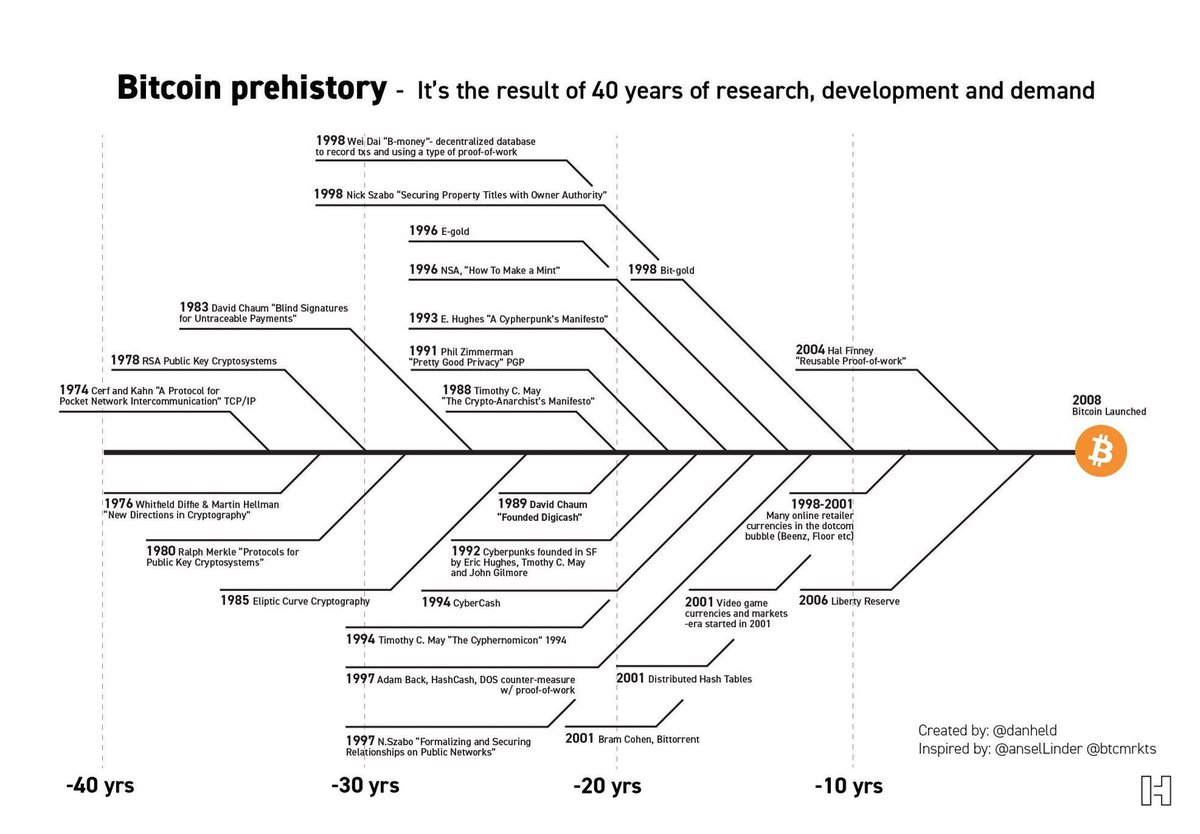
He had been working on Bitcoin for at least a year and a half before publishing the white paper.
1/ Bitcoin: a bold new world.
Satoshi published the white paper on 10/31/2008. Right at the moment of peak despair during the 2008 financial crisis. Trust had been lost in a world that ran on trust.
He had been working on Bitcoin for at least a year and a half before publishing the white paper.
Satoshi was ready and waiting to hit the send button throughout 2008. What was so special about October 31st?
The early Catholic church, in an attempt to gain believers, adopted Samhain, and created “All Saints Day” to coincide on 10/31. This is what we call “Halloween” or “All hallows’ eve"
Similarly, Satoshi was outraged at the massive breach of trust by existing financial institutions:
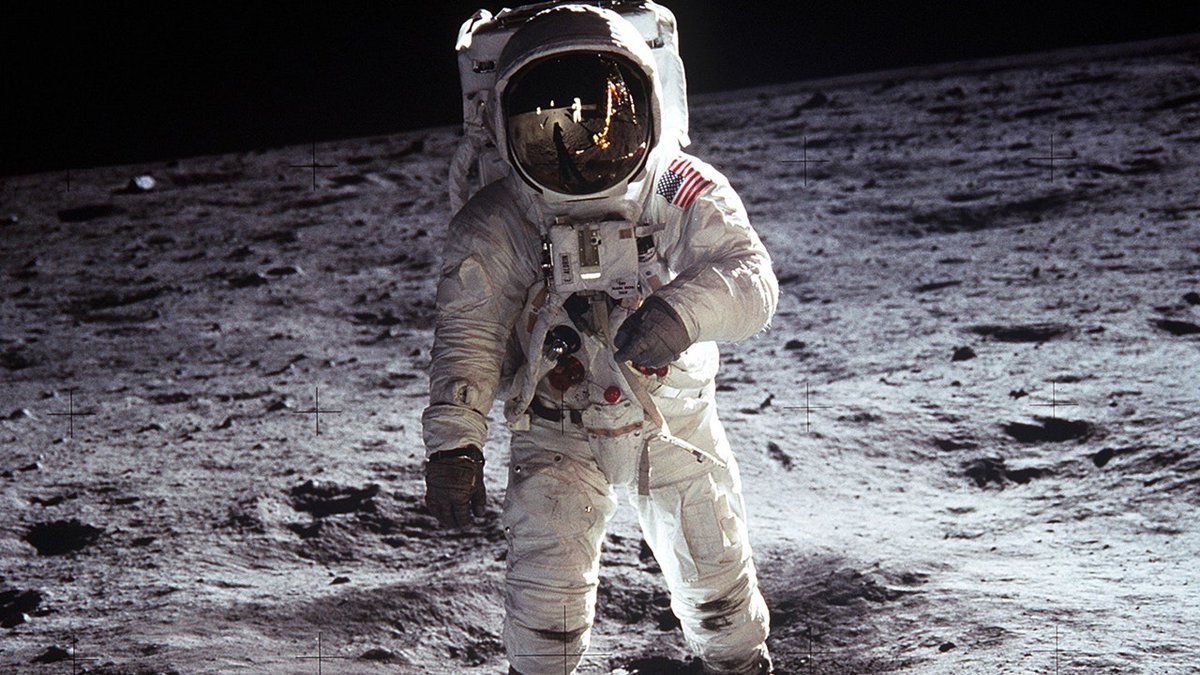
“The present is theirs; the future, for which I really worked, is mine.” - Nikola Tesla
Sign up here to receive it first👇
https://t.co/TYJDEruzvc
More from Dan Held
1/ [December Bitcoin yield update]
Over the last year and a half, I’ve earned ~1.2BTC with various yield generating services to earn an average of 5% on 30 BTC.
Here’s my journey and how to guide👇
2/ Here are the ways you can earn yield:
Lending (Easiest/most popular)
Yield: 3-6%
- Ledn: https://t.co/4x0YATuQ0v
- BlockFi: https://t.co/90Xtg2cNka
Covered calls (Harder)
Yield: 1-80%
- Deribit: https://t.co/2iQVkXlylP
- LedgerX:
3/ Earning a yield enables you to stack more sats (what I’m doing), or reduce the temptation to sell your coin through earning an income.
The yield you earn comes with RISK!
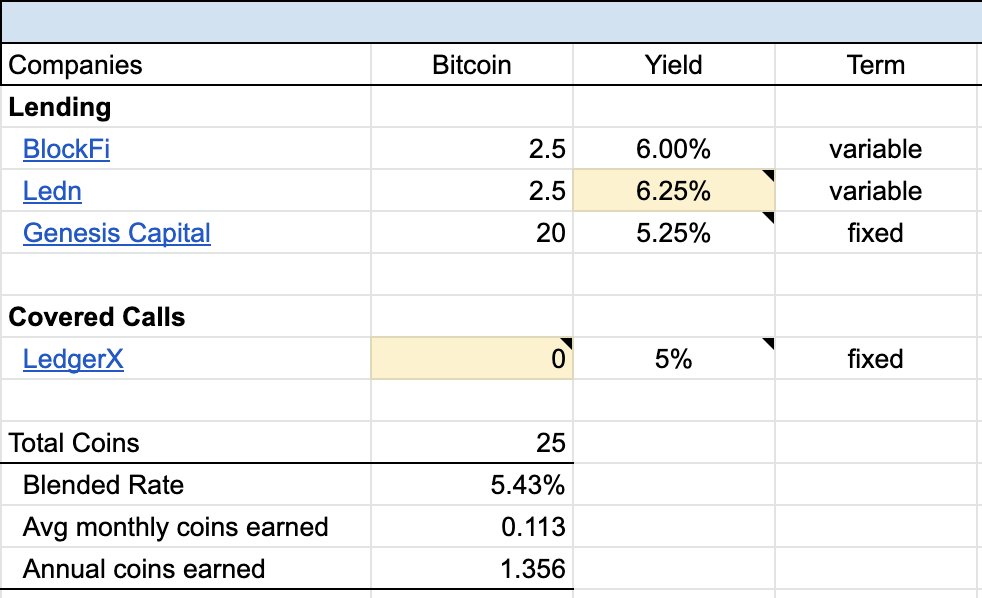
Below is my current allocation for Dec (will update MoM)
(yellow = changes)
https://t.co/PZwVYs8lFT
4a/ [Nov > Dec Changelog]
- Covered calls: approx. 4 BTC was in $40k 12/28/20 contracts. Those closed without them being exercised (a good outcome for me). However, I was nervous about my January 1/28 $50k contract so I decided to close out my position at a small loss.
4b/ [Nov > Dec Changelog]
- In process of reallocating the 5 BTC (probably will be a lending platform).
- I incorrectly had my Ledn rate at 6.5%, it's 6.25%
Over the last year and a half, I’ve earned ~1.2BTC with various yield generating services to earn an average of 5% on 30 BTC.
Here’s my journey and how to guide👇
2/ Here are the ways you can earn yield:
Lending (Easiest/most popular)
Yield: 3-6%
- Ledn: https://t.co/4x0YATuQ0v
- BlockFi: https://t.co/90Xtg2cNka
Covered calls (Harder)
Yield: 1-80%
- Deribit: https://t.co/2iQVkXlylP
- LedgerX:
3/ Earning a yield enables you to stack more sats (what I’m doing), or reduce the temptation to sell your coin through earning an income.
The yield you earn comes with RISK!
Below is my current allocation for Dec (will update MoM)
(yellow = changes)
https://t.co/PZwVYs8lFT
4a/ [Nov > Dec Changelog]
- Covered calls: approx. 4 BTC was in $40k 12/28/20 contracts. Those closed without them being exercised (a good outcome for me). However, I was nervous about my January 1/28 $50k contract so I decided to close out my position at a small loss.
4b/ [Nov > Dec Changelog]
- In process of reallocating the 5 BTC (probably will be a lending platform).
- I incorrectly had my Ledn rate at 6.5%, it's 6.25%
More from Crypto
1/ [December Bitcoin yield update]
Over the last year and a half, I’ve earned ~1.2BTC with various yield generating services to earn an average of 5% on 30 BTC.
Here’s my journey and how to guide👇
2/ Here are the ways you can earn yield:
Lending (Easiest/most popular)
Yield: 3-6%
- Ledn: https://t.co/4x0YATuQ0v
- BlockFi: https://t.co/90Xtg2cNka
Covered calls (Harder)
Yield: 1-80%
- Deribit: https://t.co/2iQVkXlylP
- LedgerX:
3/ Earning a yield enables you to stack more sats (what I’m doing), or reduce the temptation to sell your coin through earning an income.
The yield you earn comes with RISK!
Below is my current allocation for Dec (will update MoM)
(yellow = changes)
https://t.co/PZwVYs8lFT
4a/ [Nov > Dec Changelog]
- Covered calls: approx. 4 BTC was in $40k 12/28/20 contracts. Those closed without them being exercised (a good outcome for me). However, I was nervous about my January 1/28 $50k contract so I decided to close out my position at a small loss.
4b/ [Nov > Dec Changelog]
- In process of reallocating the 5 BTC (probably will be a lending platform).
- I incorrectly had my Ledn rate at 6.5%, it's 6.25%
Over the last year and a half, I’ve earned ~1.2BTC with various yield generating services to earn an average of 5% on 30 BTC.
Here’s my journey and how to guide👇
2/ Here are the ways you can earn yield:
Lending (Easiest/most popular)
Yield: 3-6%
- Ledn: https://t.co/4x0YATuQ0v
- BlockFi: https://t.co/90Xtg2cNka
Covered calls (Harder)
Yield: 1-80%
- Deribit: https://t.co/2iQVkXlylP
- LedgerX:
3/ Earning a yield enables you to stack more sats (what I’m doing), or reduce the temptation to sell your coin through earning an income.
The yield you earn comes with RISK!
Below is my current allocation for Dec (will update MoM)
(yellow = changes)
https://t.co/PZwVYs8lFT
4a/ [Nov > Dec Changelog]
- Covered calls: approx. 4 BTC was in $40k 12/28/20 contracts. Those closed without them being exercised (a good outcome for me). However, I was nervous about my January 1/28 $50k contract so I decided to close out my position at a small loss.
4b/ [Nov > Dec Changelog]
- In process of reallocating the 5 BTC (probably will be a lending platform).
- I incorrectly had my Ledn rate at 6.5%, it's 6.25%

Out of curiosity I dug into how NFT's actually reference the media you're "buying" and my eyebrows are now orbiting the moon
Short version:
The NFT token you bought either points to a URL on the internet, or an IPFS hash. In most circumstances it references an IPFS gateway on the internet run by the startup you bought the NFT from.
Oh, and that URL is not the media. That URL is a JSON metadata file
Here's an example. This artwork is by Beeple and sold via Nifty:
https://t.co/TlJKH8kAew
The NFT token is for this JSON file hosted directly on Nifty's servers:
https://t.co/GQUaCnObvX
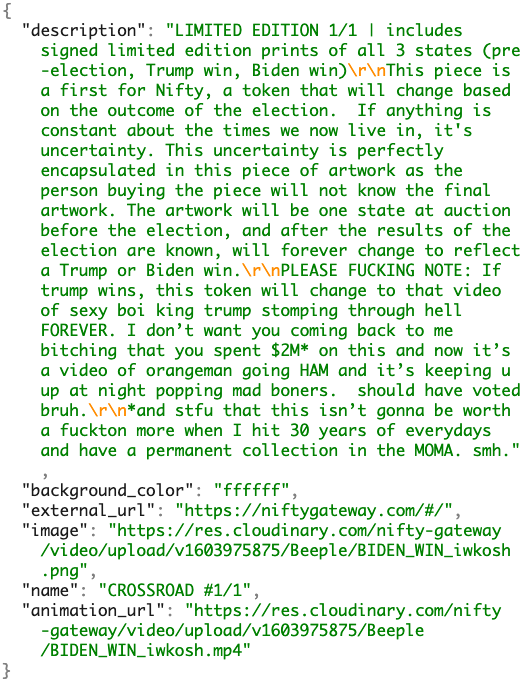
THAT file refers to the actual media you just "bought". Which in this case is hosted via a @cloudinary CDN, served by Nifty's servers again.
So if Nifty goes bust, your token is now worthless. It refers to nothing. This can't be changed.
"But you said some use IPFS!"
Let's look at the $65m Beeple, sold by Christies. Fancy.
https://t.co/1G9nCAdetk
That NFT token refers directly to an IPFS hash (https://t.co/QUdtdgtssH). We can take that IPFS hash and fetch the JSON metadata using a public gateway:
https://t.co/CoML7psBhF

Short version:
The NFT token you bought either points to a URL on the internet, or an IPFS hash. In most circumstances it references an IPFS gateway on the internet run by the startup you bought the NFT from.
Oh, and that URL is not the media. That URL is a JSON metadata file
Here's an example. This artwork is by Beeple and sold via Nifty:
https://t.co/TlJKH8kAew
The NFT token is for this JSON file hosted directly on Nifty's servers:
https://t.co/GQUaCnObvX
THAT file refers to the actual media you just "bought". Which in this case is hosted via a @cloudinary CDN, served by Nifty's servers again.
So if Nifty goes bust, your token is now worthless. It refers to nothing. This can't be changed.
"But you said some use IPFS!"
Let's look at the $65m Beeple, sold by Christies. Fancy.
https://t.co/1G9nCAdetk
That NFT token refers directly to an IPFS hash (https://t.co/QUdtdgtssH). We can take that IPFS hash and fetch the JSON metadata using a public gateway:
https://t.co/CoML7psBhF

I'm sure someone else has explained this, but it is just so cool and I want to explain how this works.
So Curve is awesome for swaps between similar assets, right? The fact that they trade very close to each other is a key part about how Curve works, using it's custom swap invariant function.
That's step 1
Step 2 is that Synthetix is awesome for creating "synthetic assets" (aka synths) which are assets that trade like other assets, that are backed by another, entirely different asset. Basically, a plastic banana that I can buy and sell like a real banana.
Synthetix has a feature that lets you swap between any two synths with zero slippage and a flat fee. That's because it is simply converting the sythentic asset into another synthetic asset, the backing for the synth doesn't change it just uses a different price oracle now.
This is important. Absolutely no slippage, at any size
Swap $1m sUSD for $1m sBTC? flat 0.3% fee
Swap $10m sUSD for $10m sBTC? flat 0.3% fee
swap $100m sUSD for $100m sBTC? Well, there isn't that many synths in Curve, yet but you get the point. The only limit is the pool depth
— Andre Cronje (@AndreCronjeTech) January 15, 2021
So Curve is awesome for swaps between similar assets, right? The fact that they trade very close to each other is a key part about how Curve works, using it's custom swap invariant function.
That's step 1
Step 2 is that Synthetix is awesome for creating "synthetic assets" (aka synths) which are assets that trade like other assets, that are backed by another, entirely different asset. Basically, a plastic banana that I can buy and sell like a real banana.
Synthetix has a feature that lets you swap between any two synths with zero slippage and a flat fee. That's because it is simply converting the sythentic asset into another synthetic asset, the backing for the synth doesn't change it just uses a different price oracle now.
This is important. Absolutely no slippage, at any size
Swap $1m sUSD for $1m sBTC? flat 0.3% fee
Swap $10m sUSD for $10m sBTC? flat 0.3% fee
swap $100m sUSD for $100m sBTC? Well, there isn't that many synths in Curve, yet but you get the point. The only limit is the pool depth


