To use it to buy Altcoins and make a high probability entry, the following conditions needs to be fulfilled.
For a long.
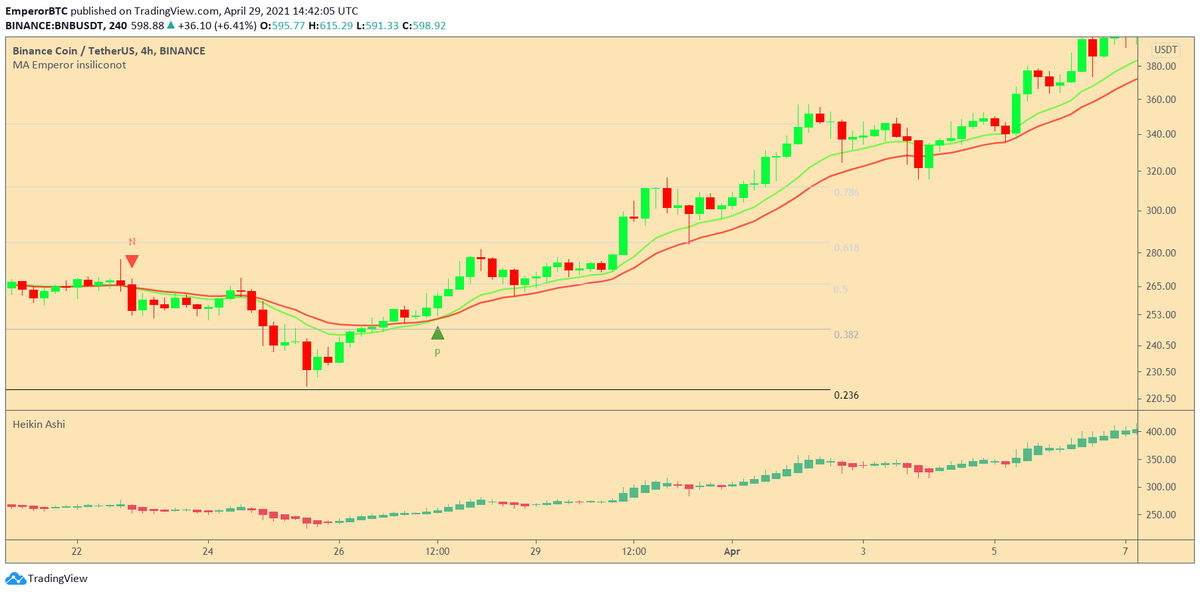
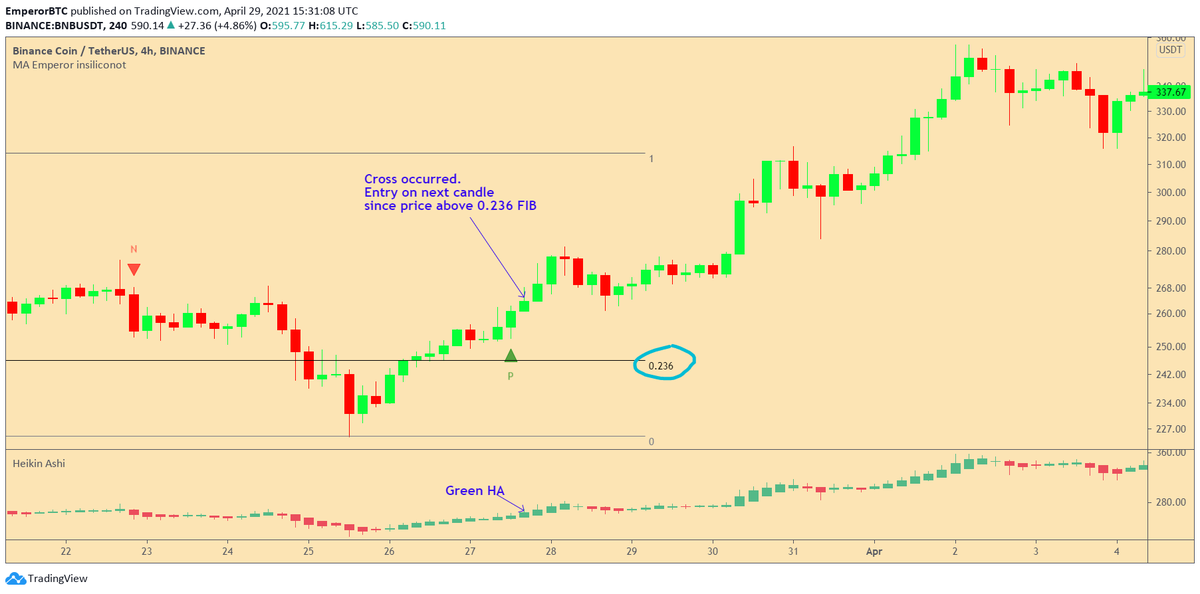
1. A green candle Closes above the cross.
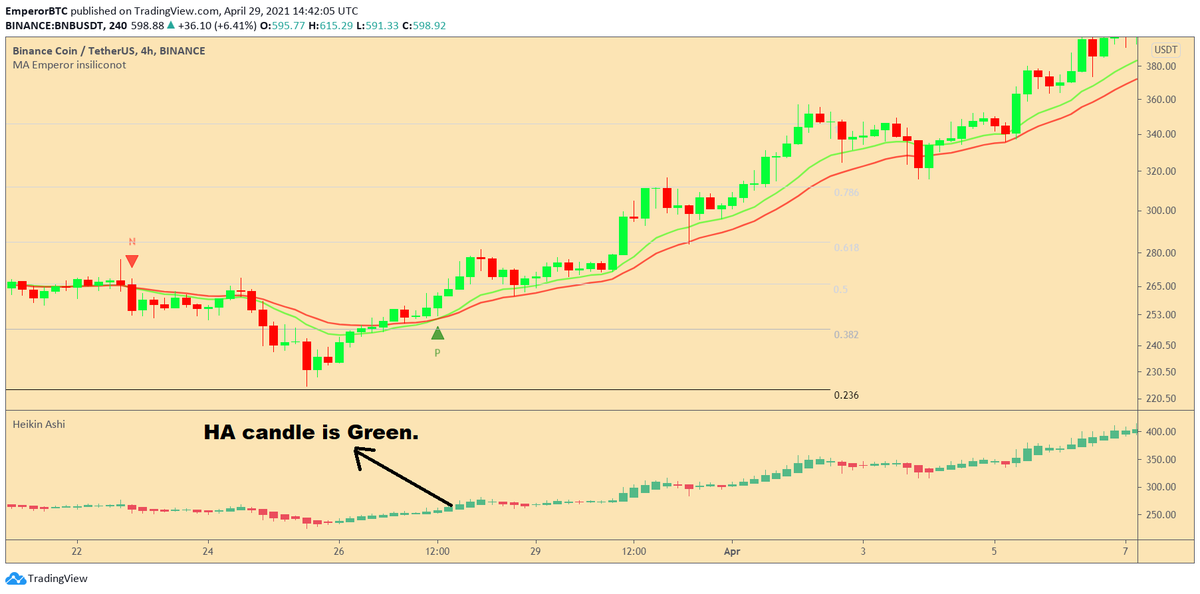
2. Heikin Ashi candle turns green.
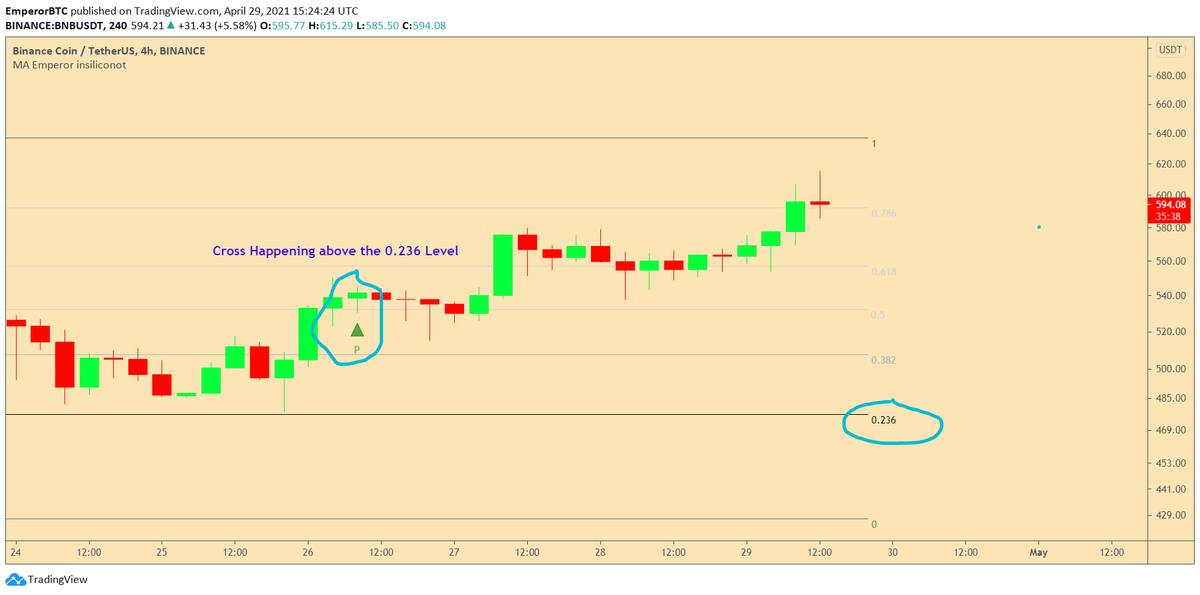
3. Price should be above 0.236 Fib from the swing high.
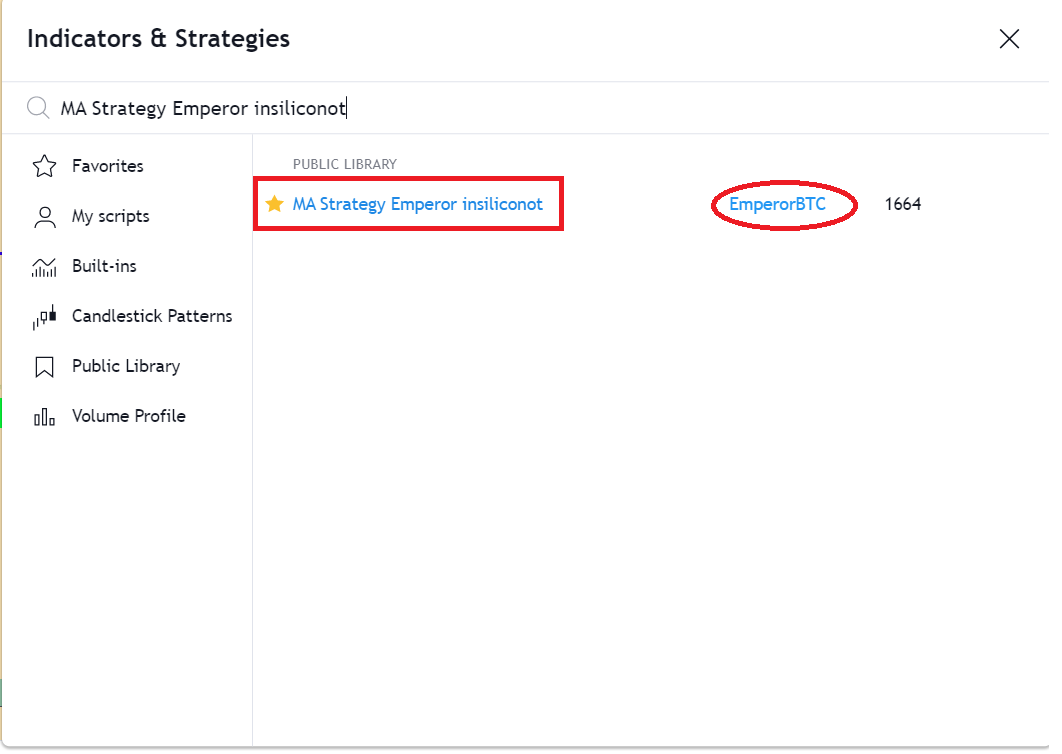
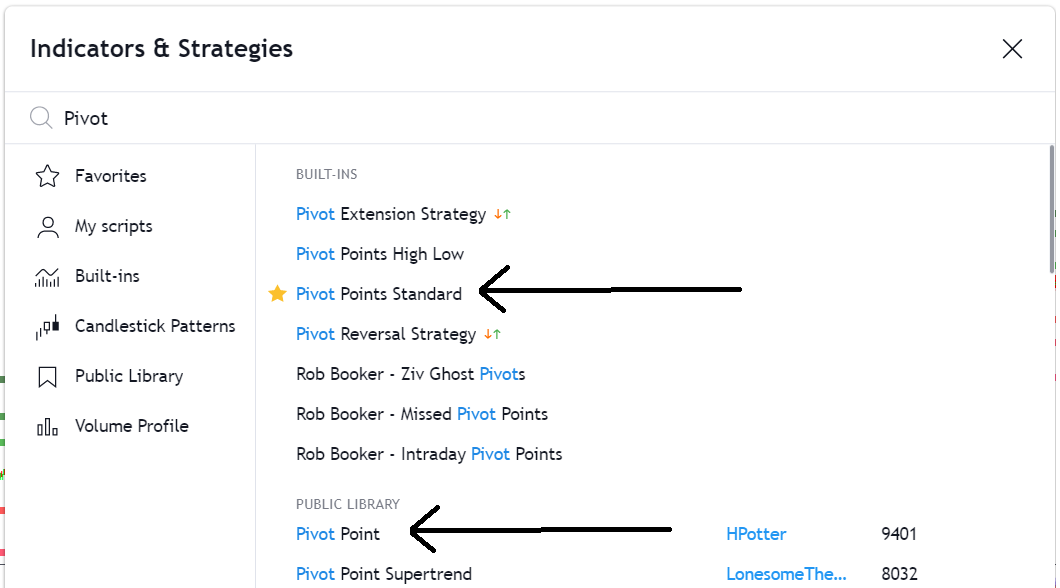
How to add the Indicator.
1. Click on the link and Add it to favorites and apply.
https://t.co/Kn90qgDjMi 2. Or Search it in the tab and then apply it.
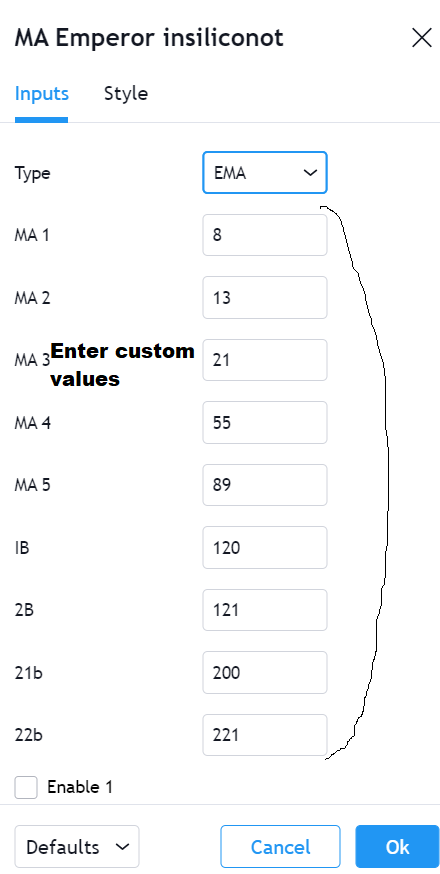
The indicator itself the most comprehensive Moving Average Indicator which provides 9 MAs and 13 Different times of MAs.
The base of the indicator was by
@insiliconot. To further enhance it, I have added a cross indicator on the cross which works the best historically on Alts.
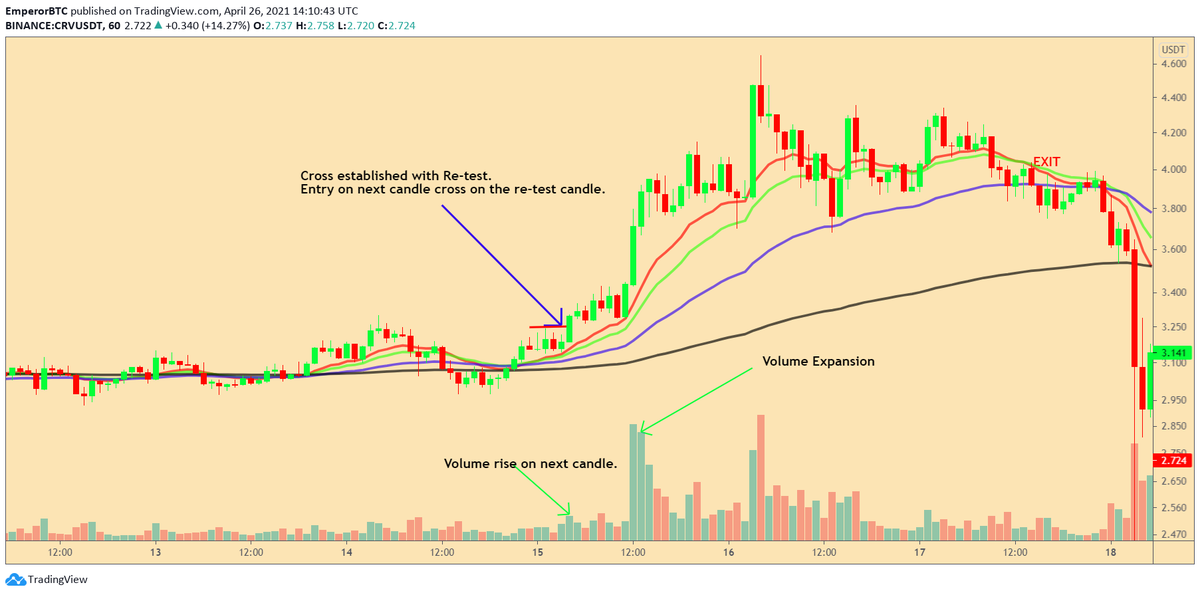
Condition 1- The cross.
Entry is made when a Cross occurs on the EMA 13/21.
The indicator automatically indicators the Cross with P for a positive cross or N for a negative cross.
This is the first condition for an Entry.
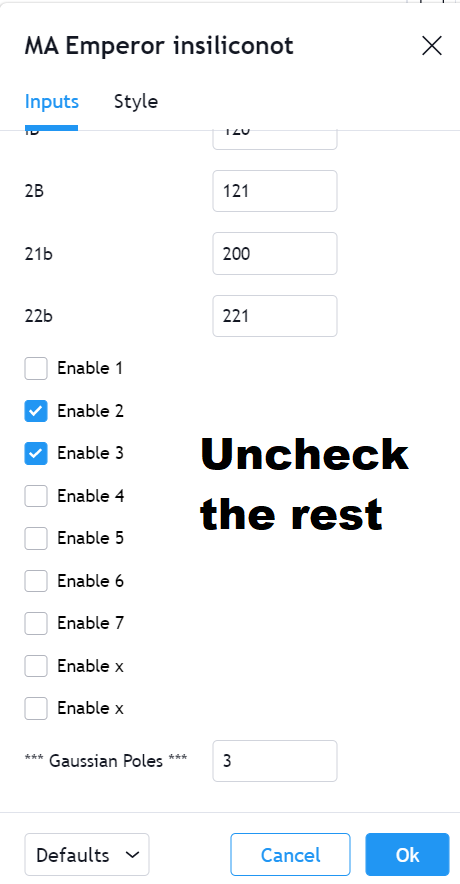
The cross would occur between the MA 2 and MA 3.
Enable only these 2 MAs for a clear view of these MAs and if you're not using the other MAs.
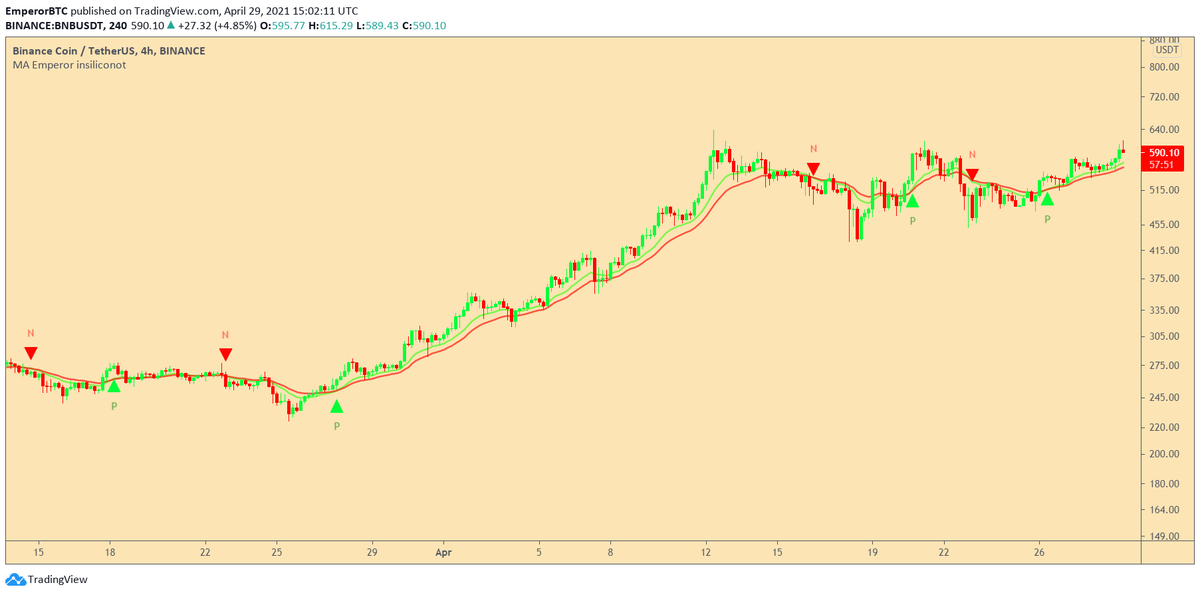
If you want Just the crosses to Appear and not the MAs, then you can uncheck ALL. Fig. 2 demonstrates only the cross with no MA.
Condition 2- Green Heikin Ashi.
The Hekin Ashi, in a long Entry should have turned Green.
The HA candle indicator used here is the one by 'garethyeo'
Note.
Wait for the cross to confirm by letting the candle close.
The Next HA candle should be a green one.
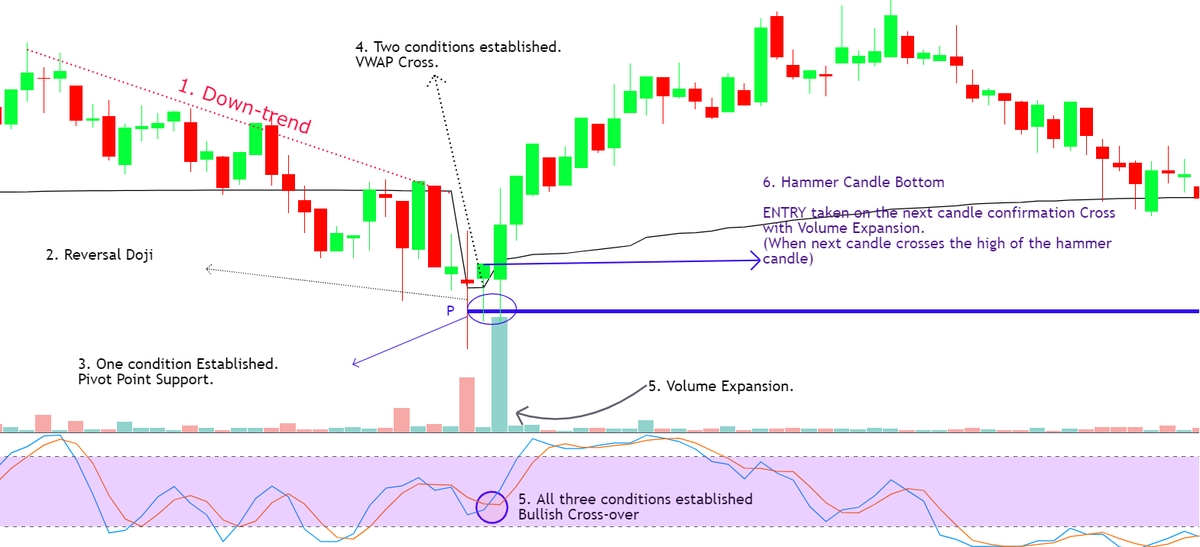
Condition 3- The price should have AT LEAST cross 0.236 level of retracement from the local swing high.
If you're not familiar with FIB levels, they are easy to plot. Here is a quick 2 minute tutorial by
@CryptoMellany Link-
https://t.co/gEr8BECpEf
Putting it all together.
1. Wait for the MA2 and MA3 cross confirm and the candle to close.
2. Heikin Ashi should be green.
3. Price above 0.236 Fib line.
The exact opposite conditions are applicable for a short entry.
The strategy can be improved a lot more with PA knowledge an personal discretion.
As always this is not a BUY SELL indicator buy a guide.
The stop loss can be placed as per the previous Stop Loss Guide.
The strategy WILL fail at times. It can be easily managed by
- Stop Loss
- Price action
Thanks to
@insiliconot for providing the most versatile MAs script.
@johnnie_jacks for the Idea.
@VaidaBogdan and
@C_ompounding for their great help in modification and testing.
The time frame for the Cross is mentioned on the Charts. You can test it on other time frames as needed.
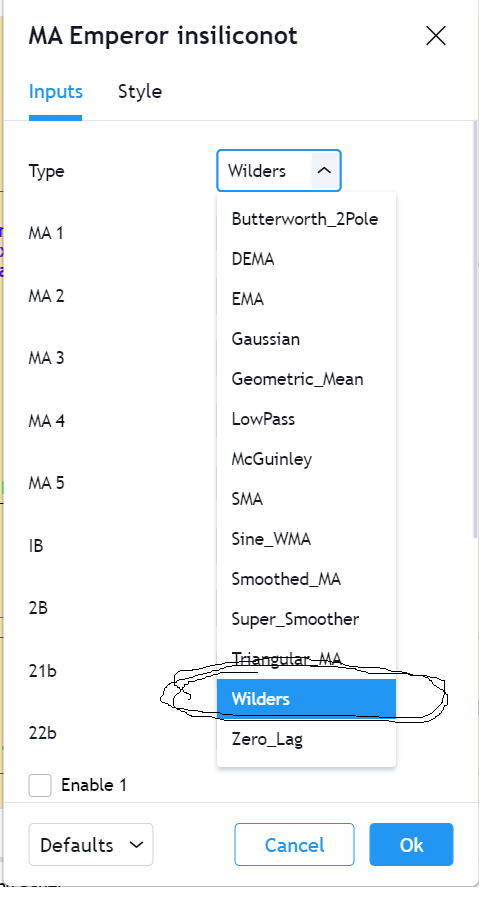
Instead on EMA, you can choose Wilder's MA for on some charts and assets as see how it performs.
I hope you enjoyed this strategy and test it.
Remember to use your PA discretion to avoid fake signals.
You can see all other strategies and Tutorials for free here-
https://t.co/718jU9ySKx All the Best.
PLEASE share it with all traders.
I could help someone.