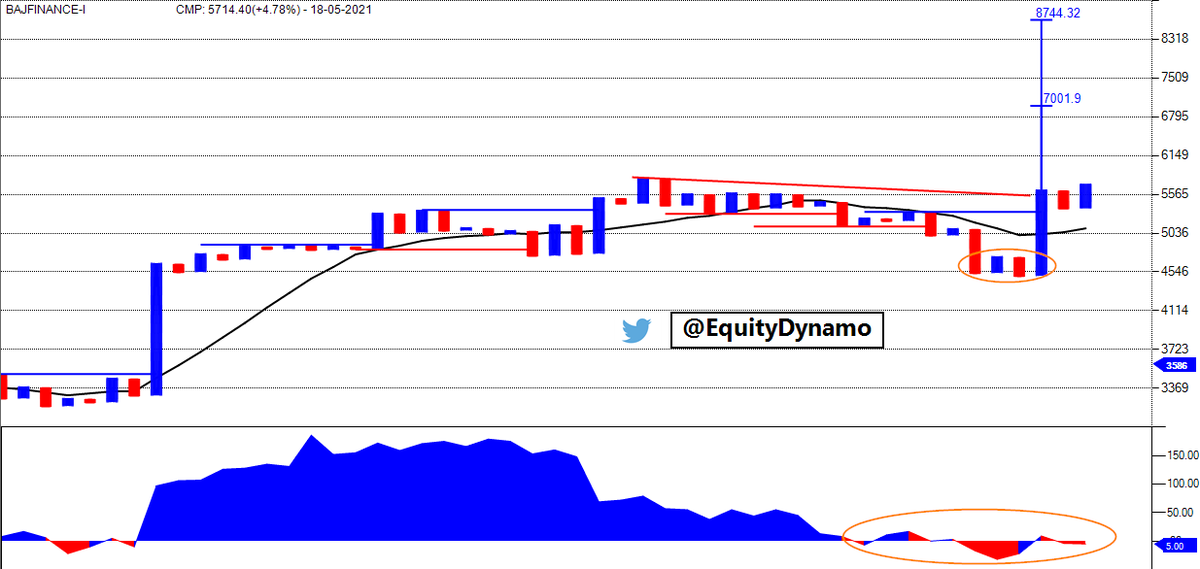
#BajFinance futures #Bullish #WolfeWave in progress
https://t.co/3geuTBLjpi
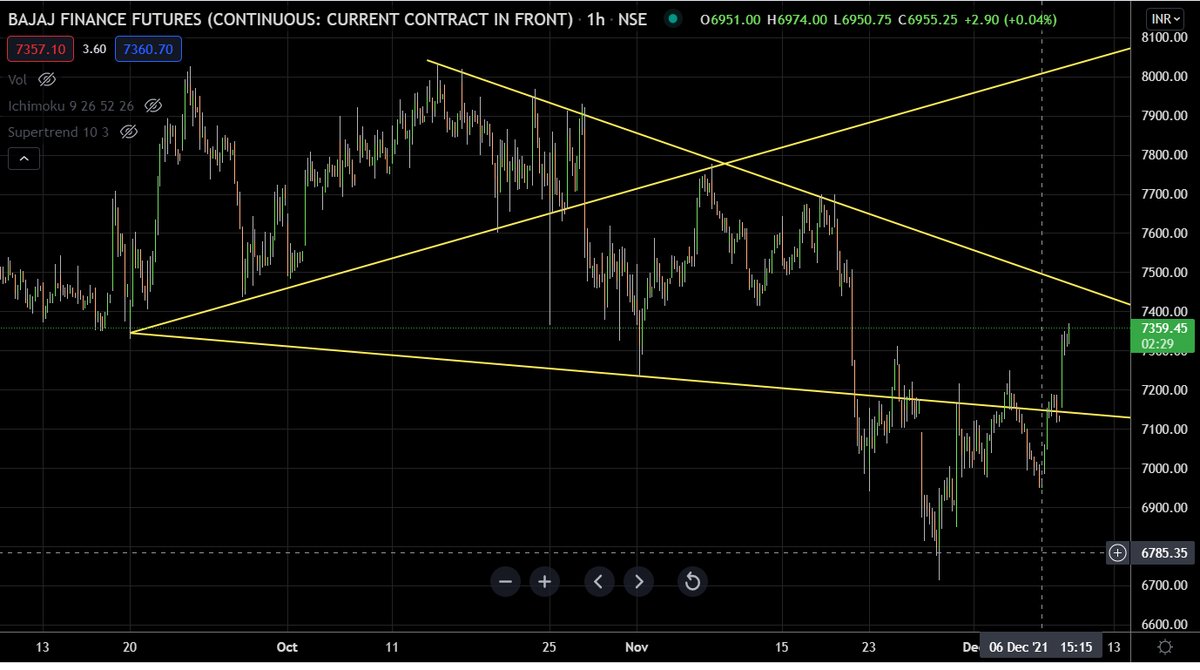
#BajFinance daily TF probable #BullishWolfeWave@DeyTrading, does it make sense?
— DTBhat (@dtbhat) December 4, 2021
There was a failed attempt from a previous low. pic.twitter.com/ZYjGI0iEom
More from DTBhat
More from Bajajfinance
BAJFINANCE
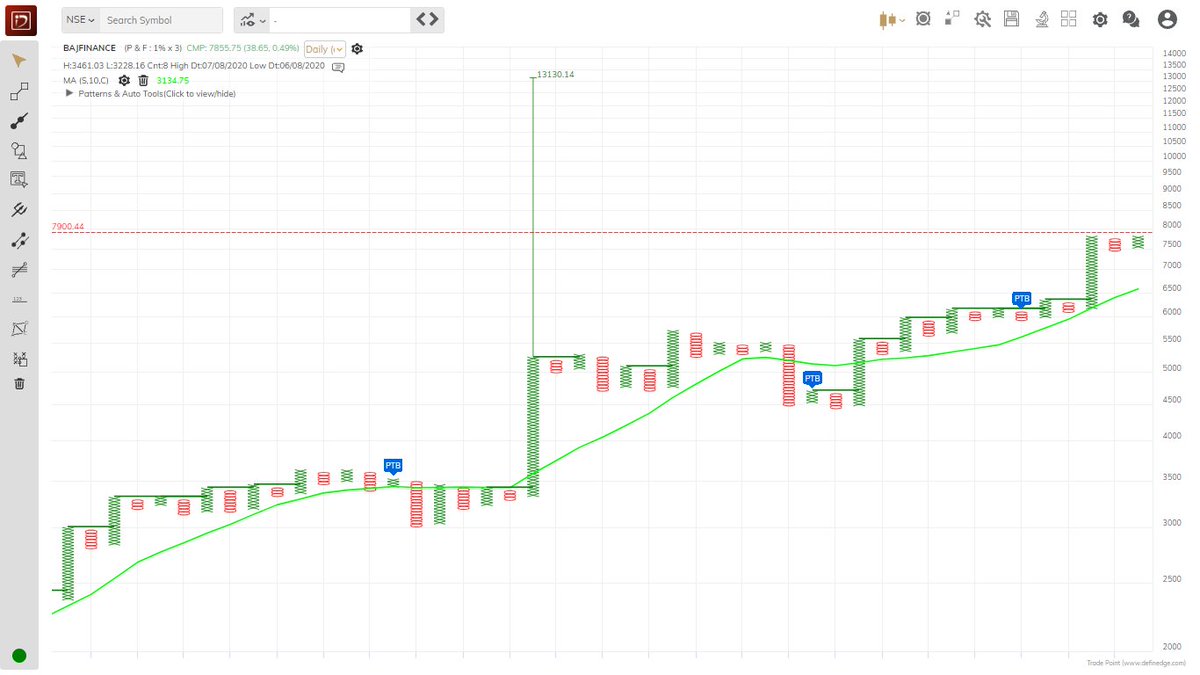
Double Top Buy above 7904.58 daily close on 1% Box size chart. https://t.co/v7IfC9FlEE
BAJFINANCE
— Saket Reddy (@saketreddy) February 4, 2021
Double Top Buy & Super Pattern - Bullish triggered on today's close above 5440.8 on 3% Box size chart. https://t.co/5roCSY2sLV pic.twitter.com/lBBzzTZUVy
You May Also Like
1/OK, data mystery time.
This New York Times feature shows China with a Gini Index of less than 30, which would make it more equal than Canada, France, or the Netherlands. https://t.co/g3Sv6DZTDE
That's weird. Income inequality in China is legendary.
Let's check this number.
2/The New York Times cites the World Bank's recent report, "Fair Progress? Economic Mobility across Generations Around the World".
The report is available here:
3/The World Bank report has a graph in which it appears to show the same value for China's Gini - under 0.3.
The graph cites the World Development Indicators as its source for the income inequality data.
4/The World Development Indicators are available at the World Bank's website.
Here's the Gini index: https://t.co/MvylQzpX6A
It looks as if the latest estimate for China's Gini is 42.2.
That estimate is from 2012.
5/A Gini of 42.2 would put China in the same neighborhood as the U.S., whose Gini was estimated at 41 in 2013.
I can't find the <30 number anywhere. The only other estimate in the tables for China is from 2008, when it was estimated at 42.8.