Some ofthe biggest breakouts occur after Volatility Contraction, the analogy is that more a spring is pressed, higher it jumps whenever it gets released.
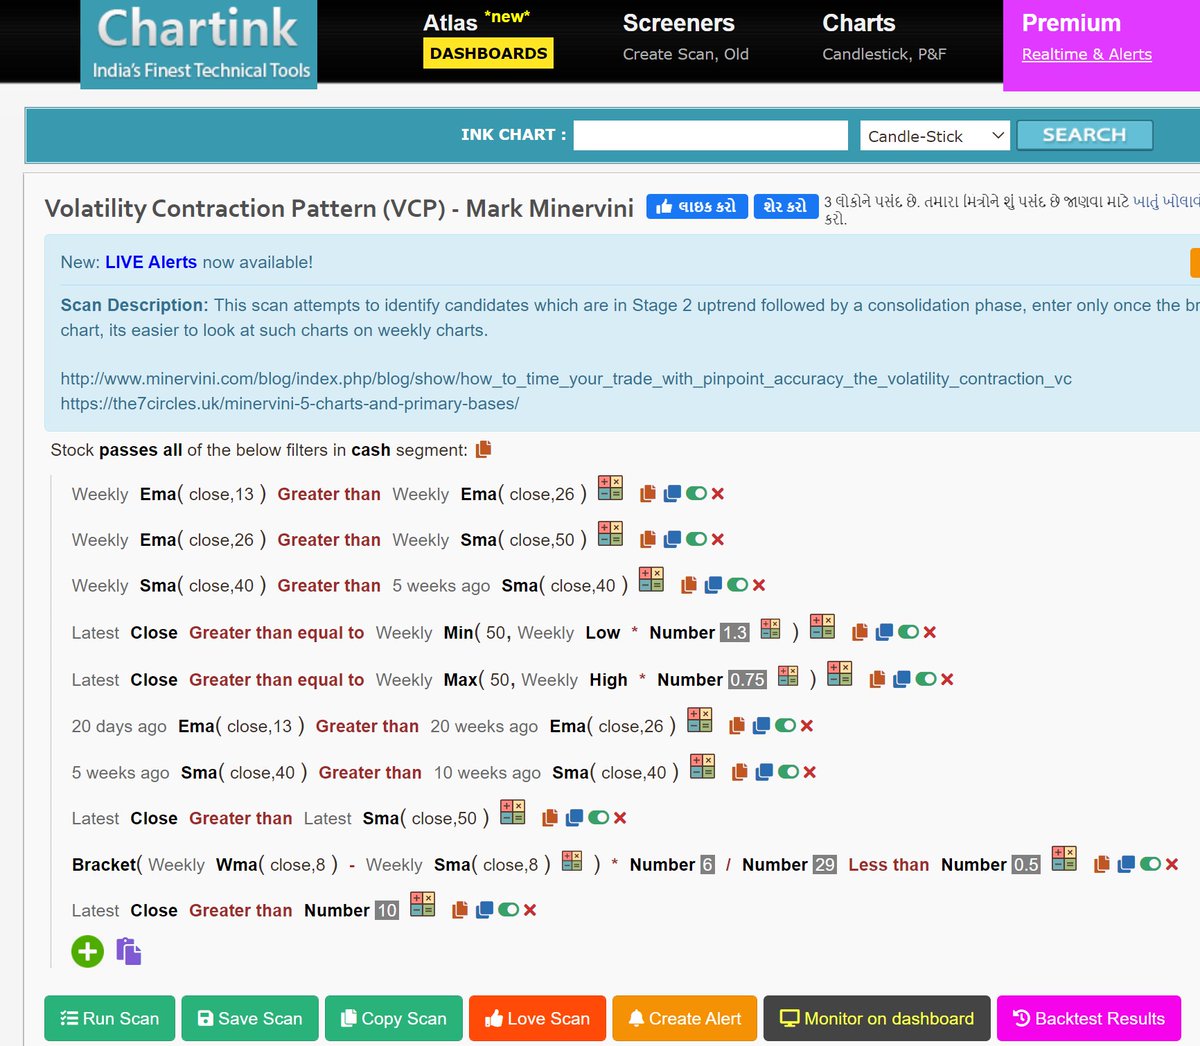
There is a VCP Scanner on chartink (Not mine). This may also be used to find potential Breakouts.
More from Professor
You may modify & fine tune this as per your own criteria like adding RSI or ADX or other indicators. https://t.co/FdiPG1c4s0
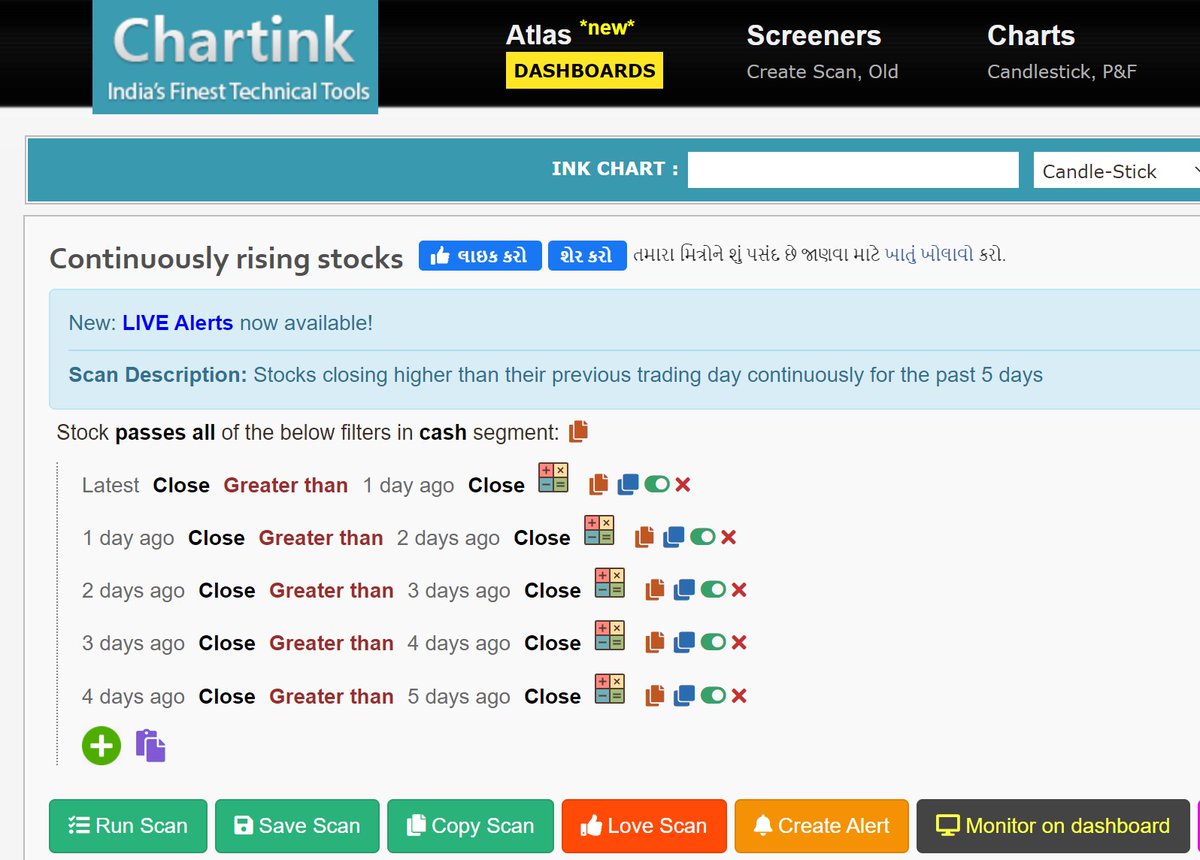
Bhai, can you please educate us, how do you find the breakout stocks? I mean which scanner? Any inputs would be much helpful.
— Loyalty Respect (@Novicetrader99) October 1, 2021
First two are good enough, if you want to really go in depth then go for 3rd one by Al Brooks later (Its only for serious and committed learners, as its too detailed and would tire out a casual reader). https://t.co/2Vgq5gCVXL

Book name plz
— \ufe0e (@12354368ys_g) March 4, 2022
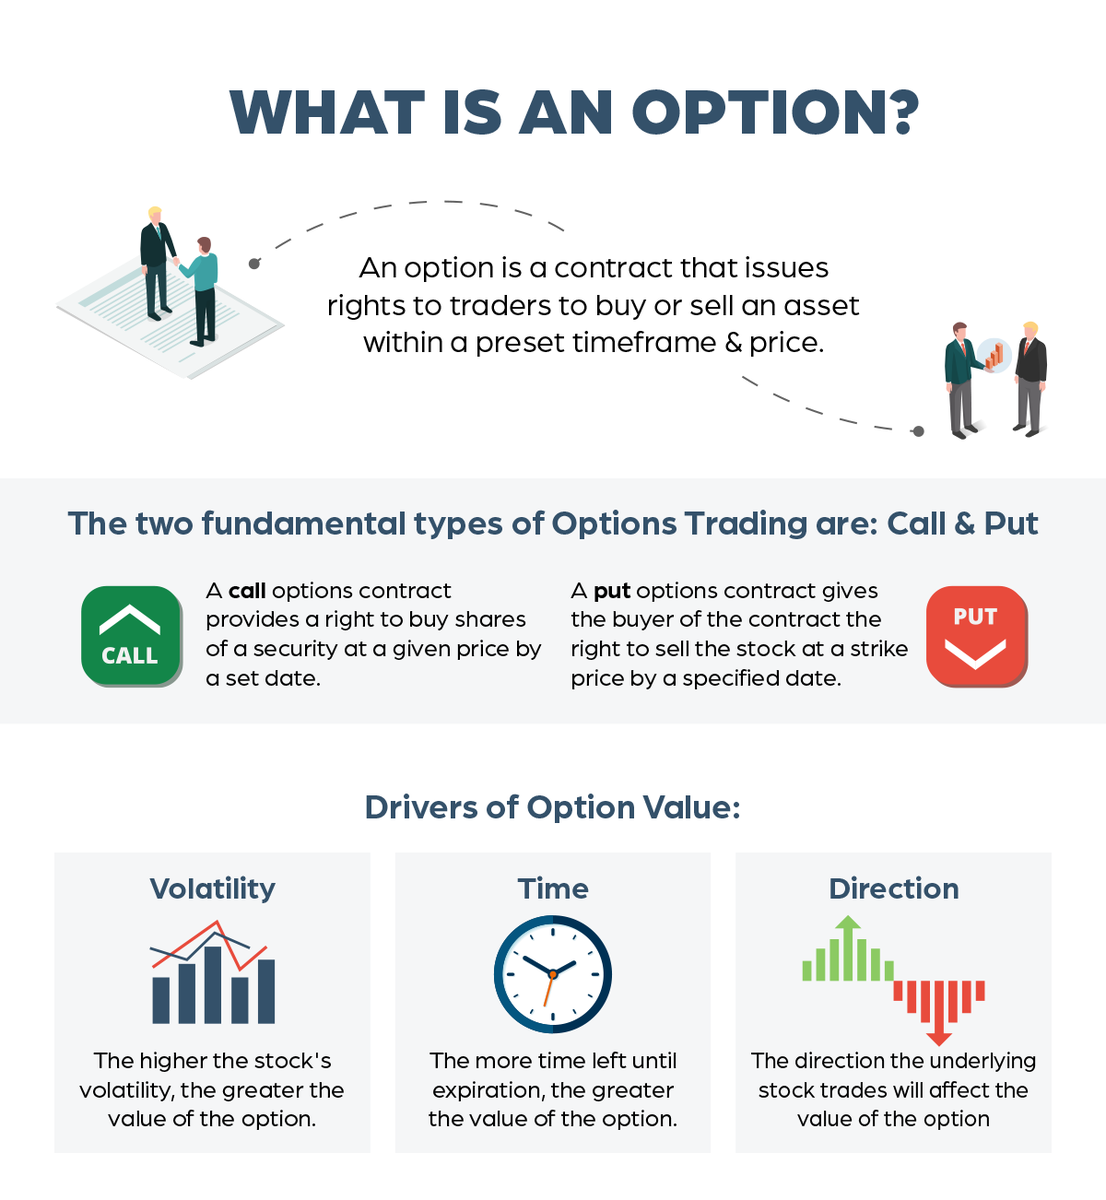
Lest some charlie jumps to point out, let me make it clear that I haven't invented anything in stock market, all my knowledge of stock market comes from old farts. Just my observation is my own. https://t.co/uHNw8tV4AO
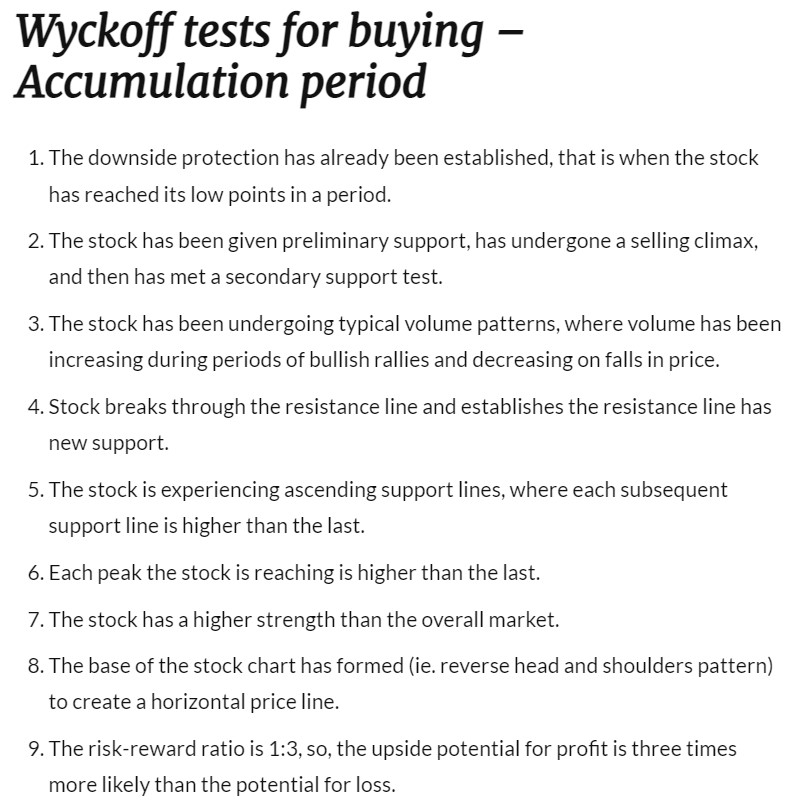
Plz advice how to identify accumulation and distribution phase...... to me Both looks same
— VIVEK VAID (@bobvaid) February 12, 2022
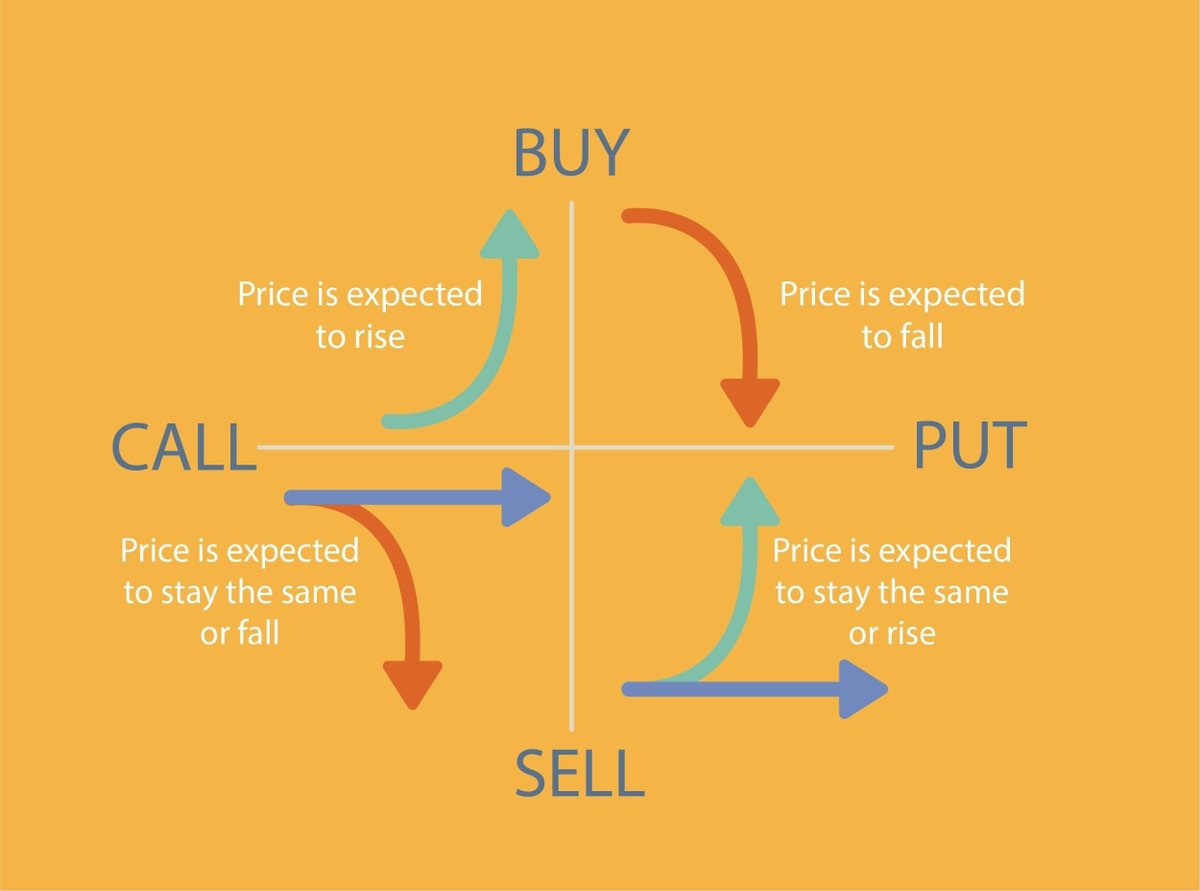
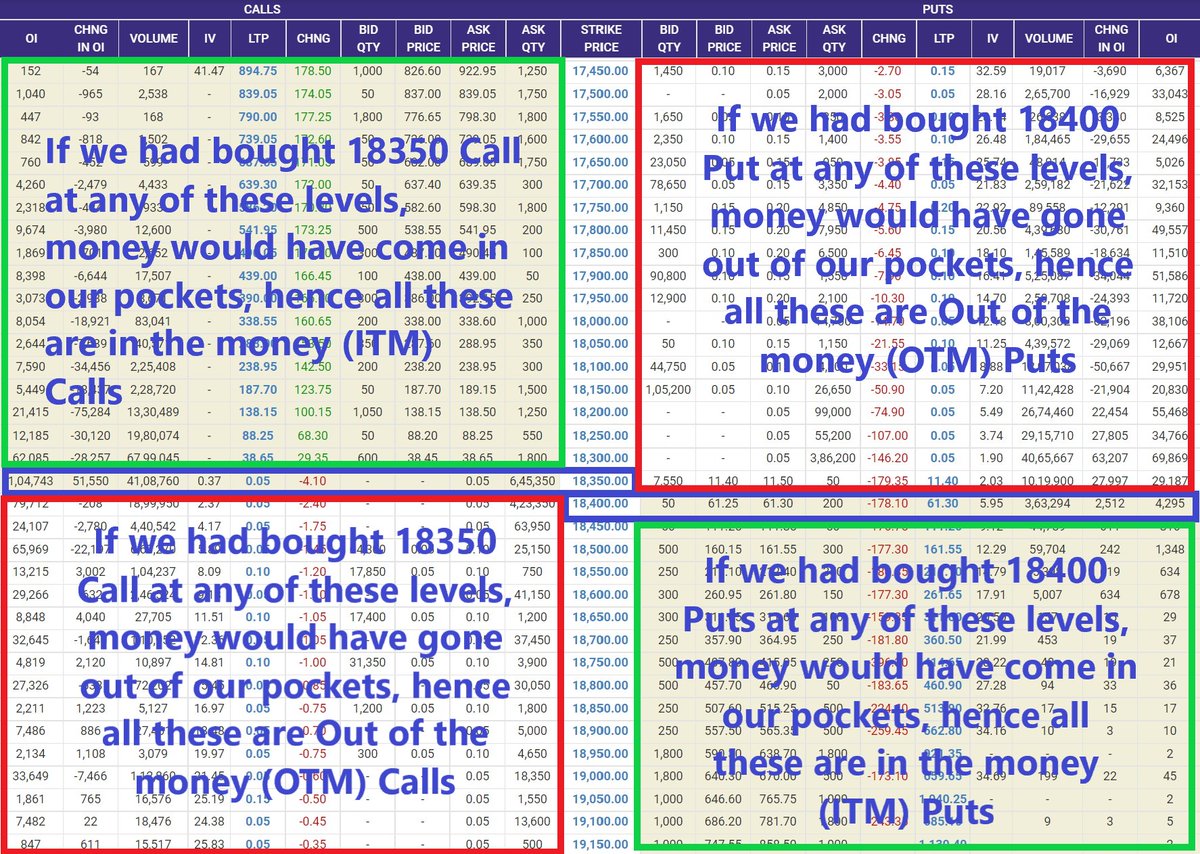
See Large OIl buildup kin strikes par hai and in between strikes data kaise move ho raha hai.
Thumb Rule:
Calls Reduction + Puts addition = Upthrust
Calls Addition + Put Reduction = Down move
Higher the Delta OI velocity, faster is the move.
For Nifty Intraday Traders: As of now, this seems to be a buy on dip market and looks like there won't be any juicy trades on short side. Will update if data changes. https://t.co/PCIyyPld4A pic.twitter.com/ES3o4z60rY
— Professor (@DillikiBiili) March 11, 2022
More from Screeners


Do Share the above tweet 👆
These are going to be very simple yet effective pure price action based scanners, no fancy indicators nothing - hope you liked it.
https://t.co/JU0MJIbpRV
52 Week High
One of the classic scanners very you will get strong stocks to Bet on.
https://t.co/V69th0jwBr
Hourly Breakout
This scanner will give you short term bet breakouts like hourly or 2Hr breakout
Volume shocker
Volume spurt in a stock with massive X times

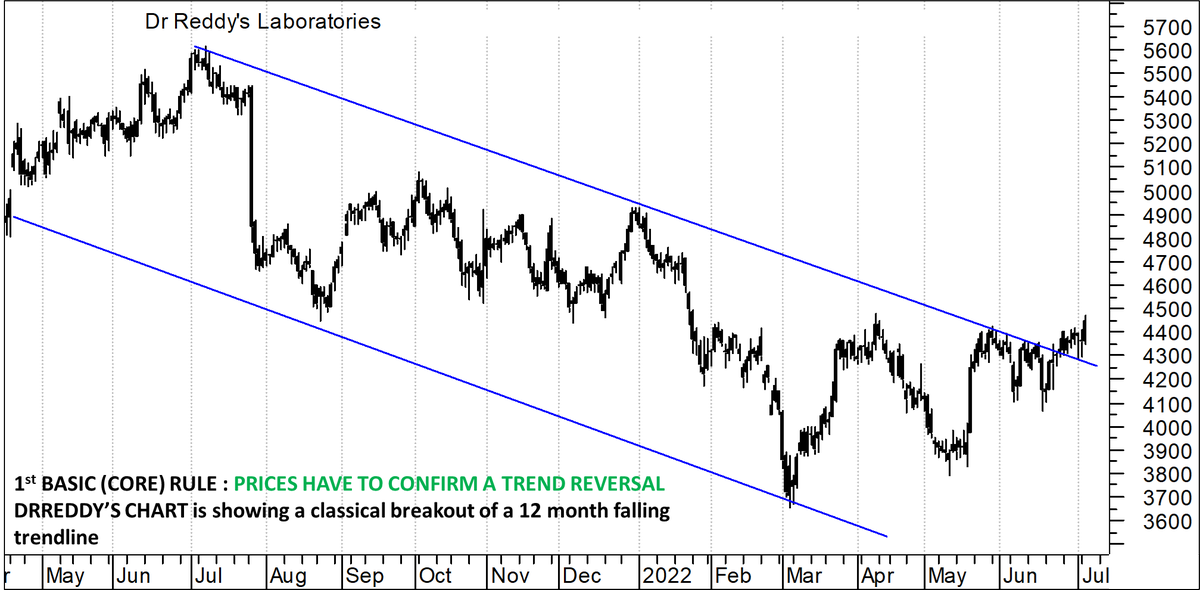
The 3 most important rules which I follow in spotting a major trend reversal laid out in this stock, 'as it is'.
1. Trend reversal
2. Price patterns
3. Indicator confirmation
Perfect TA chart.
All boxes ticked !!
Do comment, like and share !!!
#DRREDDY https://t.co/4JGg71GenE
Today at 2 pm:
— Kunal Bothra (@kbbothra) July 5, 2022
I will bring to you one of the SUPER FINEST TECHNICAL CHART setup on a largecap name.
Agar yeh nahi chal paya toh kuch nahi chal paayega\u2026
Retweeet tsunami has to come for this one\u2026 #stock #breakout #technical

#nifty50 https://t.co/64ZktWHQev
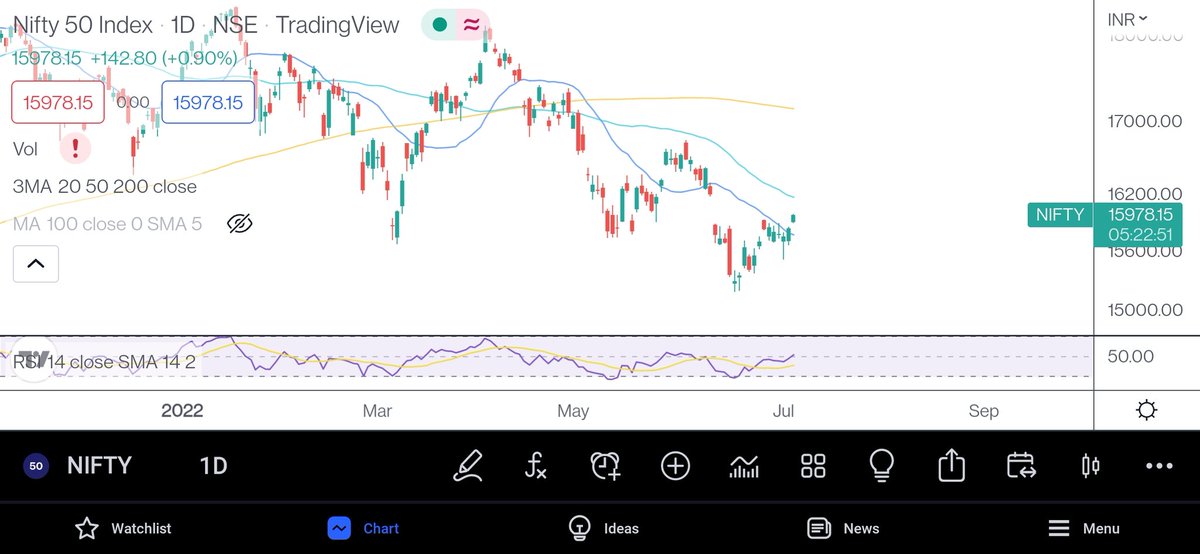
This is the maximum upside for now, post that I am looking for an 8-9% fall in index.#nifty50 pic.twitter.com/BcSOiwWuBs
— Aakash Gangwar (@akashgngwr823) June 24, 2022