
when price starts rising it would be pulled back to VWAP line. Then buyers would again rush in to buy the stock taking it to price higher
Trending Day Simple Option Buying Strategy
A thread about SIMPLE OPTION BUYING STRATEGY USING VWAP
A Thread 🧵
when price starts rising it would be pulled back to VWAP line. Then buyers would again rush in to buy the stock taking it to price higher
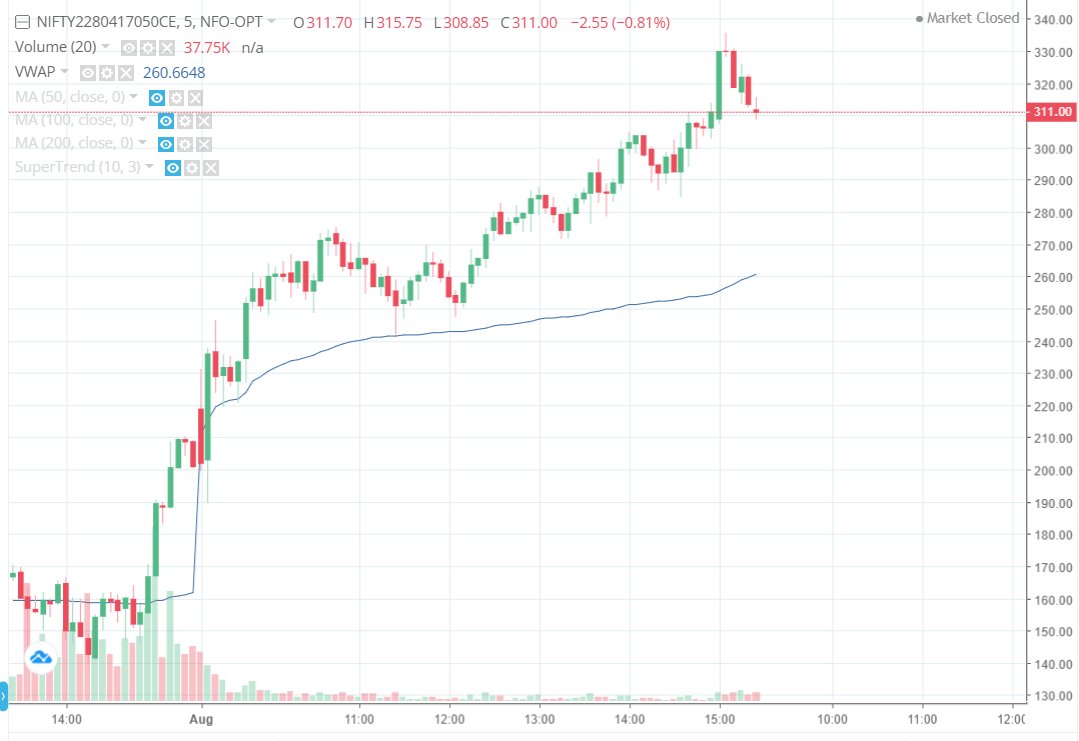
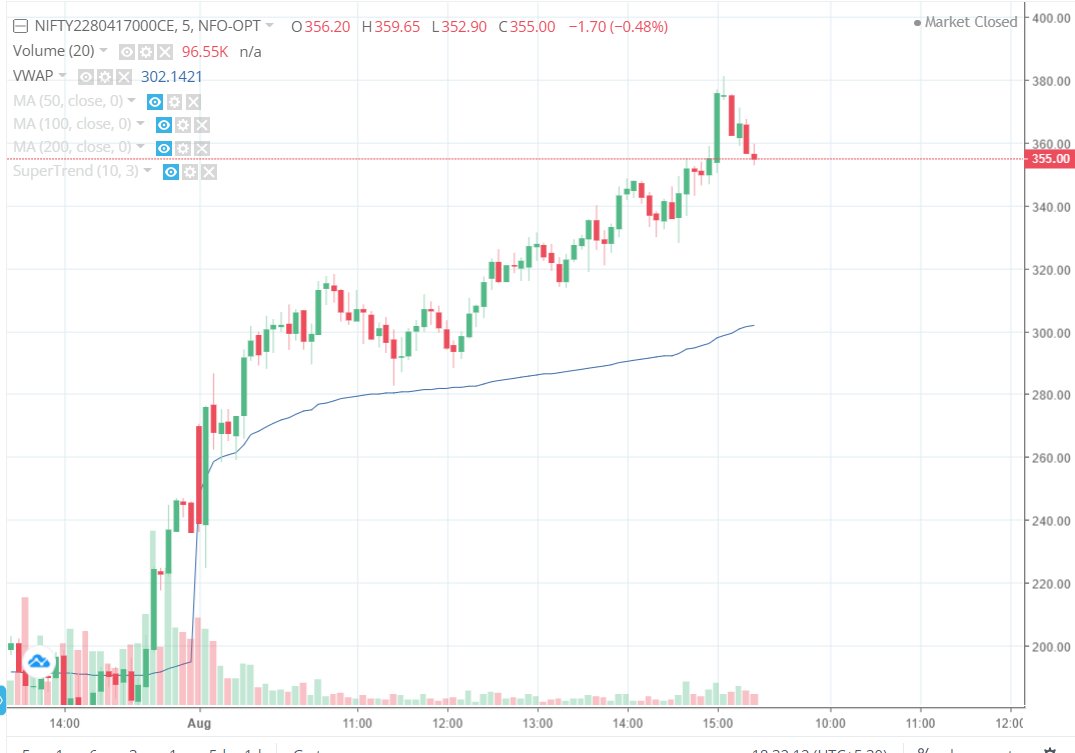
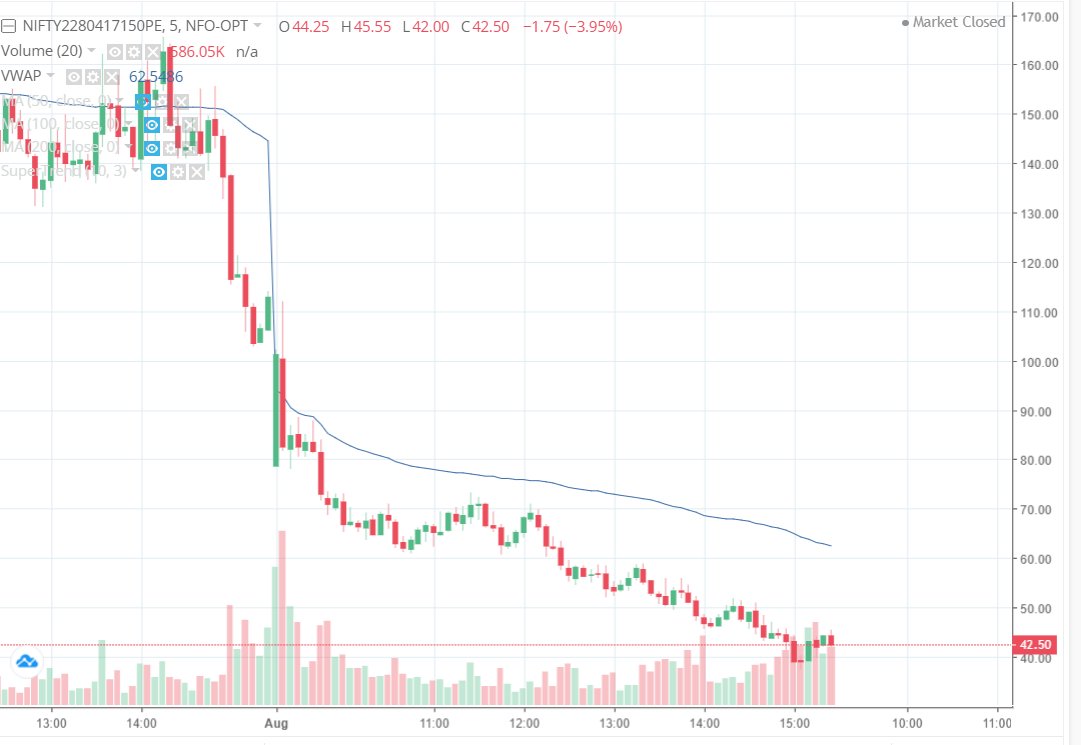
compare the charts of CALLS and PUTS attached here to get an overall idea. This is a simple strategy that most don’t use
17000 CE, 17050 CE, 17100 CE, 17150 CE charts


17500 PE, 17450 PE, 17400 PE, 17350 PE charts for understanding


STOP LOSS can be, when a FULL CANDLE open and closes below VWAP.
We can take reentry only once in a day when price goes above VWAP again
Join our Telegram channel for more such updates
https://t.co/yY38y9Eepi
More from Swapnil Kommawar



Generally, VWAP is used to know the strength in a buying or selling. VWAP means VOLUME WEIGHTED AVERAGE PIRCE
A thread 🧵🧵🧵🧵🧵
Retweet/like for maximum reach
👉when price starts rising it would be pulled back to VWAP line. Then buyers would again rush in to buy the stock taking price higher.
👉If we compare the CALL and PUT charts, we can identify the correct entry. On trending days VWAP acts as support/resistance.
👉If market is trending UPSIDE, VWAP acts as support in CALL option charts of ATM STRIKES and same VWAP acts as RESISTANCE in PUT option charts of ATM STRIKES
(Use VWAP on 5 minutes chart on OPTION CHARTS)
https://t.co/TLmAiypV45
👉If market is trending DOWNSIDE, VWAP acts as support in PUT option charts of ATM STRIKES and same VWAP acts as RESISTANCE in CALL option charts of ATM STRIKE
A thread 🧵🧵🧵🧵🧵
Retweet/like for maximum reach
👉when price starts rising it would be pulled back to VWAP line. Then buyers would again rush in to buy the stock taking price higher.
👉If we compare the CALL and PUT charts, we can identify the correct entry. On trending days VWAP acts as support/resistance.
👉If market is trending UPSIDE, VWAP acts as support in CALL option charts of ATM STRIKES and same VWAP acts as RESISTANCE in PUT option charts of ATM STRIKES
(Use VWAP on 5 minutes chart on OPTION CHARTS)
https://t.co/TLmAiypV45
👉If market is trending DOWNSIDE, VWAP acts as support in PUT option charts of ATM STRIKES and same VWAP acts as RESISTANCE in CALL option charts of ATM STRIKE
More from All












How can we use language supervision to learn better visual representations for robotics?
Introducing Voltron: Language-Driven Representation Learning for Robotics!
Paper: https://t.co/gIsRPtSjKz
Models: https://t.co/NOB3cpATYG
Evaluation: https://t.co/aOzQu95J8z
🧵👇(1 / 12)
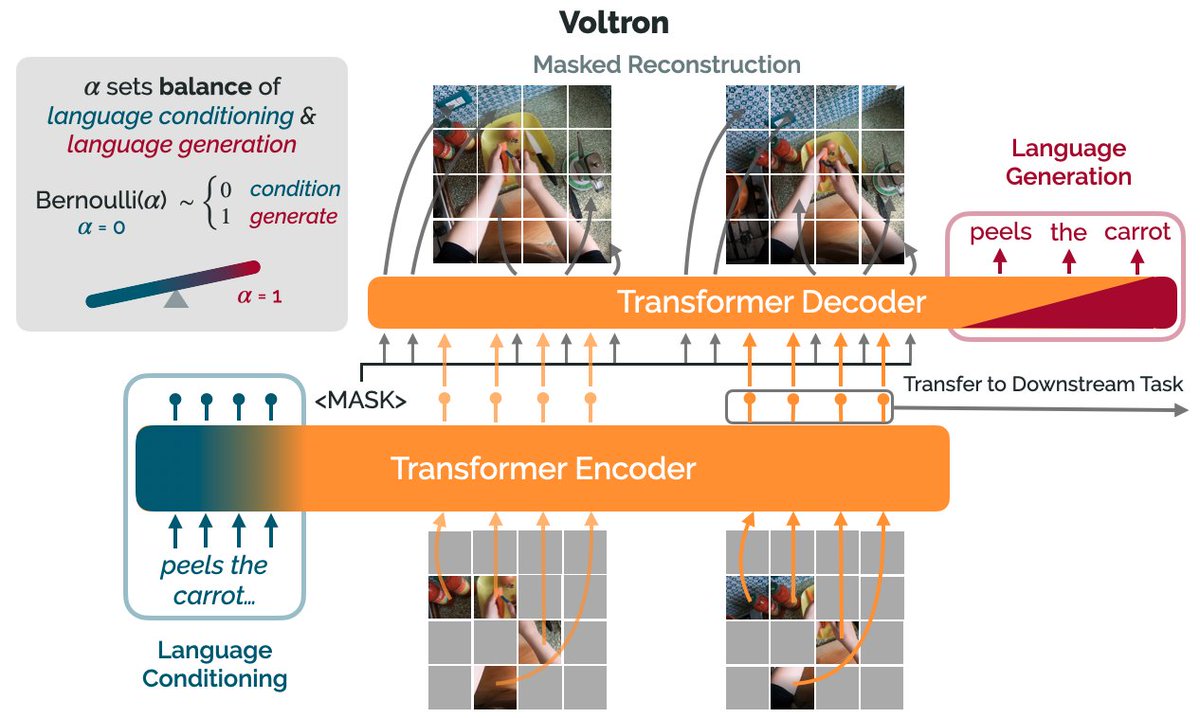
Videos of humans performing everyday tasks (Something-Something-v2, Ego4D) offer a rich and diverse resource for learning representations for robotic manipulation.
Yet, an underused part of these datasets are the rich, natural language annotations accompanying each video. (2/12)
The Voltron framework offers a simple way to use language supervision to shape representation learning, building off of prior work in representations for robotics like MVP (https://t.co/Pb0mk9hb4i) and R3M (https://t.co/o2Fkc3fP0e).
The secret is *balance* (3/12)
Starting with a masked autoencoder over frames from these video clips, make a choice:
1) Condition on language and improve our ability to reconstruct the scene.
2) Generate language given the visual representation and improve our ability to describe what's happening. (4/12)
By trading off *conditioning* and *generation* we show that we can learn 1) better representations than prior methods, and 2) explicitly shape the balance of low and high-level features captured.
Why is the ability to shape this balance important? (5/12)
Introducing Voltron: Language-Driven Representation Learning for Robotics!
Paper: https://t.co/gIsRPtSjKz
Models: https://t.co/NOB3cpATYG
Evaluation: https://t.co/aOzQu95J8z
🧵👇(1 / 12)
Videos of humans performing everyday tasks (Something-Something-v2, Ego4D) offer a rich and diverse resource for learning representations for robotic manipulation.
Yet, an underused part of these datasets are the rich, natural language annotations accompanying each video. (2/12)
The Voltron framework offers a simple way to use language supervision to shape representation learning, building off of prior work in representations for robotics like MVP (https://t.co/Pb0mk9hb4i) and R3M (https://t.co/o2Fkc3fP0e).
The secret is *balance* (3/12)
Starting with a masked autoencoder over frames from these video clips, make a choice:
1) Condition on language and improve our ability to reconstruct the scene.
2) Generate language given the visual representation and improve our ability to describe what's happening. (4/12)
By trading off *conditioning* and *generation* we show that we can learn 1) better representations than prior methods, and 2) explicitly shape the balance of low and high-level features captured.
Why is the ability to shape this balance important? (5/12)

You May Also Like











1/OK, data mystery time.
This New York Times feature shows China with a Gini Index of less than 30, which would make it more equal than Canada, France, or the Netherlands. https://t.co/g3Sv6DZTDE
That's weird. Income inequality in China is legendary.
Let's check this number.
2/The New York Times cites the World Bank's recent report, "Fair Progress? Economic Mobility across Generations Around the World".
The report is available here:
3/The World Bank report has a graph in which it appears to show the same value for China's Gini - under 0.3.
The graph cites the World Development Indicators as its source for the income inequality data.

4/The World Development Indicators are available at the World Bank's website.
Here's the Gini index: https://t.co/MvylQzpX6A
It looks as if the latest estimate for China's Gini is 42.2.
That estimate is from 2012.
5/A Gini of 42.2 would put China in the same neighborhood as the U.S., whose Gini was estimated at 41 in 2013.
I can't find the <30 number anywhere. The only other estimate in the tables for China is from 2008, when it was estimated at 42.8.
This New York Times feature shows China with a Gini Index of less than 30, which would make it more equal than Canada, France, or the Netherlands. https://t.co/g3Sv6DZTDE
That's weird. Income inequality in China is legendary.
Let's check this number.
2/The New York Times cites the World Bank's recent report, "Fair Progress? Economic Mobility across Generations Around the World".
The report is available here:
3/The World Bank report has a graph in which it appears to show the same value for China's Gini - under 0.3.
The graph cites the World Development Indicators as its source for the income inequality data.
4/The World Development Indicators are available at the World Bank's website.
Here's the Gini index: https://t.co/MvylQzpX6A
It looks as if the latest estimate for China's Gini is 42.2.
That estimate is from 2012.
5/A Gini of 42.2 would put China in the same neighborhood as the U.S., whose Gini was estimated at 41 in 2013.
I can't find the <30 number anywhere. The only other estimate in the tables for China is from 2008, when it was estimated at 42.8.