‘These longitudinal data comprise a clear pattern of very modest to negligible changes in muscle mass and strength in transgender women suppressing testosterone for at least 12 months.’
Systematic review from Joanna Harper on muscular changes in transwomen.
‘These findings suggest that strength may be well preserved in transwomen during the first 3 years of hormone
‘These longitudinal data comprise a clear pattern of very modest to negligible changes in muscle mass and strength in transgender women suppressing testosterone for at least 12 months.’
Pictures of kittens welcome.
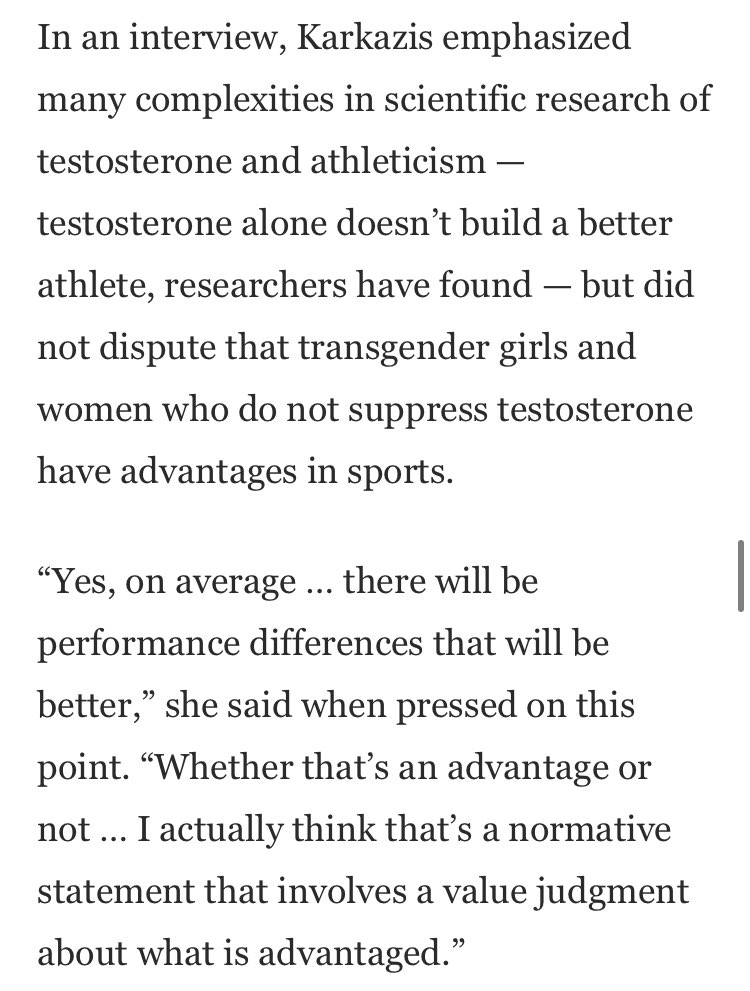
When two groups of scientists that have been cast on ‘opposing sides’ of an issue reach the same conclusions about a dataset, perhaps we might be able to accept what that dataset shows and move forward with solutions.
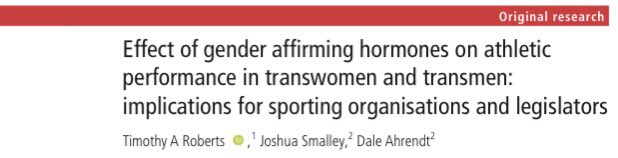
A new systematic review on the effects of cross-hormone therapy on physical parameters relevant for sport performance in transgender women. My brief thoughts are summarised in a thread: 1/6 https://t.co/eHmcCnt63H
— Tommy Lundberg (@TLexercise) March 3, 2021
More from Emma Hilton
@Hogshead3Au @BARBARABULL11 @boysvswomen @cbrennansports @Martina @devarona64 OK.
Fitness data from over 85k AUS children aged 9–17 yrs showed that, compared with 9 yr females, 9 yr males were 9.8% faster in sprints, 16.6% faster over 1 mile, could jump 9.5% further, could complete 33% more push-ups in 30 s and had 13.8% stronger grip.
@BARBARABULL11 @boysvswomen @cbrennansports @Martina @devarona64 Here is my full description of that data.
Example:
1.6km timed run (CV endurance)
The *best* 17 yr old girls are matched by *average* 17 yr old boys, and beaten, by some measure, by the best 9 yr old
@BARBARABULL11 @boysvswomen @cbrennansports @Martina @devarona64 Male advantage of a similar magnitude was detected in a study of Greek children, where, compared with 6-year-old females, 6-year-old males completed 16.6% more shuttle runs in a given time and could jump 9.7% further from a standing
@BARBARABULL11 @boysvswomen @cbrennansports @Martina @devarona64 In terms of aerobic capacity, 6- to 7-year-old males have been shown to have a higher absolute and relative (to body mass) VO2max than 6- to 7-year-old
@BARBARABULL11 @boysvswomen @cbrennansports @Martina @devarona64 Pre-puberty performance differences are not negligible, and could be mediated, to some extent, by genetic factors and/or activation of the hypothalamic–pituitary–gonadal axis during the neonatal period, sometimes referred to as “minipuberty”.
Fitness data from over 85k AUS children aged 9–17 yrs showed that, compared with 9 yr females, 9 yr males were 9.8% faster in sprints, 16.6% faster over 1 mile, could jump 9.5% further, could complete 33% more push-ups in 30 s and had 13.8% stronger grip.
@BARBARABULL11 @boysvswomen @cbrennansports @Martina @devarona64 Here is my full description of that data.
Example:
1.6km timed run (CV endurance)
The *best* 17 yr old girls are matched by *average* 17 yr old boys, and beaten, by some measure, by the best 9 yr old
Here is summary data from Catley and Tomkinson, 2012, who collated performance data from 85347 Australian schoolchildren aged 9-17 years old. pic.twitter.com/qKdxqywpoq
— Emma Hilton (@FondOfBeetles) November 19, 2020
@BARBARABULL11 @boysvswomen @cbrennansports @Martina @devarona64 Male advantage of a similar magnitude was detected in a study of Greek children, where, compared with 6-year-old females, 6-year-old males completed 16.6% more shuttle runs in a given time and could jump 9.7% further from a standing
@BARBARABULL11 @boysvswomen @cbrennansports @Martina @devarona64 In terms of aerobic capacity, 6- to 7-year-old males have been shown to have a higher absolute and relative (to body mass) VO2max than 6- to 7-year-old
@BARBARABULL11 @boysvswomen @cbrennansports @Martina @devarona64 Pre-puberty performance differences are not negligible, and could be mediated, to some extent, by genetic factors and/or activation of the hypothalamic–pituitary–gonadal axis during the neonatal period, sometimes referred to as “minipuberty”.
With Cathy's permission, I have converted the stats from this paper into graphic form.
Read on.
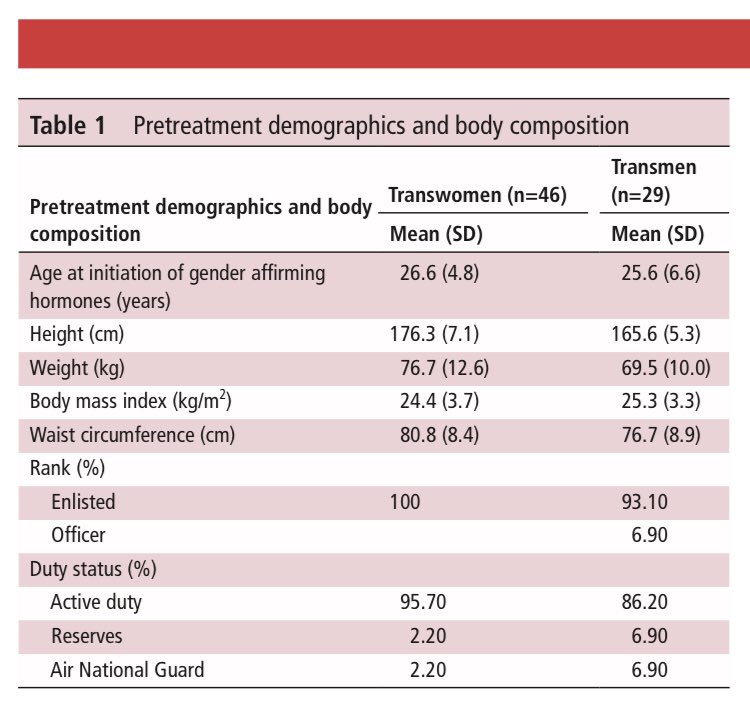
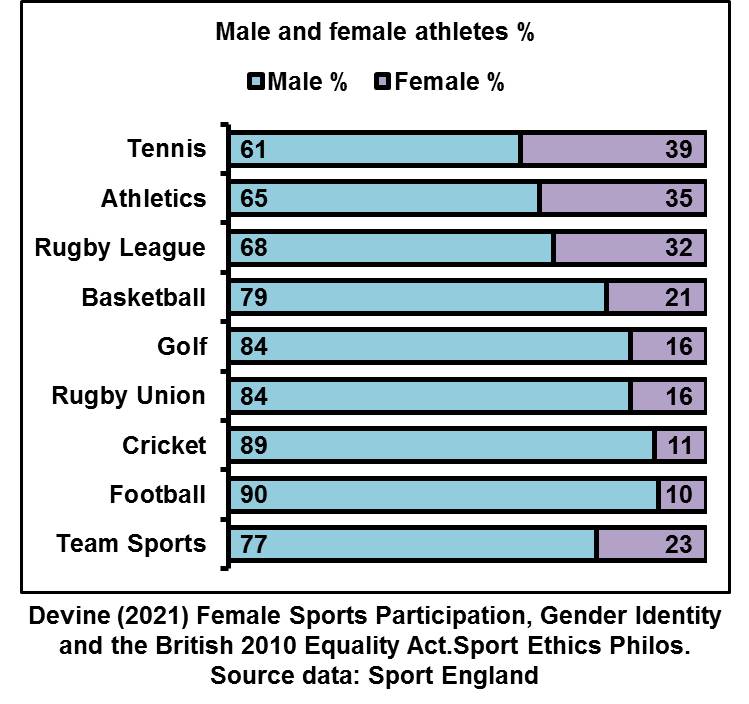
First, Cathy reported the numbers and % split of UK males and females playing selected sports. Male participation is higher than female participation.
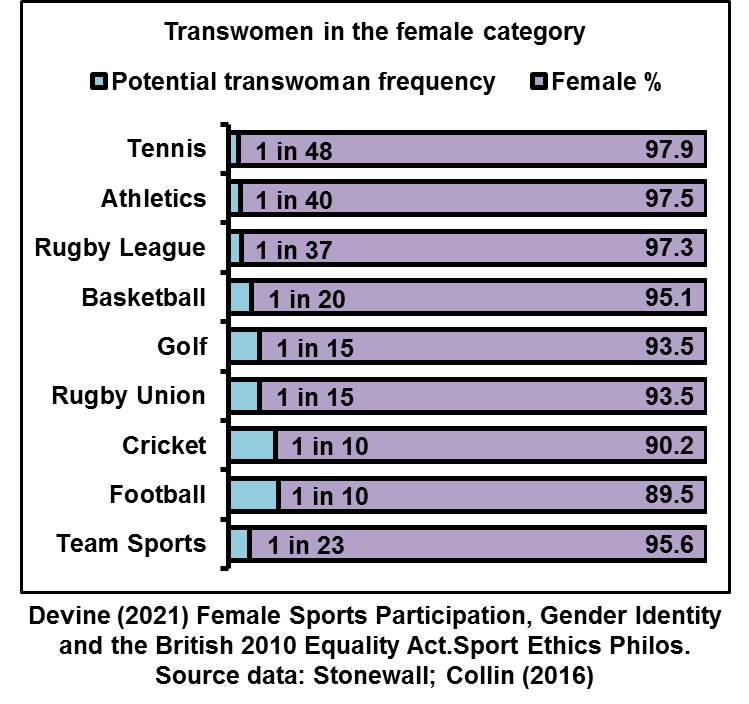
Then, Cathy used population estimates to predict the numbers of male and female athletes who would be eligible, under a selfID model, for the opposite sex category. Cathy calculated these trans athletes as % of opposite sex category.
I have calculated the trans athletes as a frequency in the opposite sex category.
Here is the data for transwomen in female sports.
Here is the data for transmen in male sports.
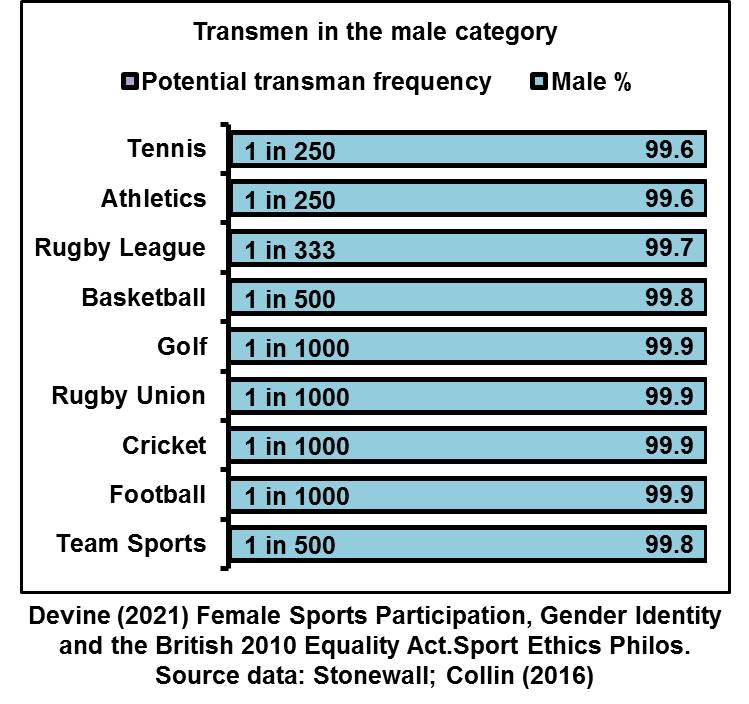
Read on.
Delighted my research article Female Sports Participation, Gender Identity and the British 2010 Equality Act is now published in Sport Ethics and Philosophy. 1/https://t.co/wNPz2sd2WD
— Cathy Devine (@cathydevine56) November 9, 2021
First, Cathy reported the numbers and % split of UK males and females playing selected sports. Male participation is higher than female participation.
Then, Cathy used population estimates to predict the numbers of male and female athletes who would be eligible, under a selfID model, for the opposite sex category. Cathy calculated these trans athletes as % of opposite sex category.
I have calculated the trans athletes as a frequency in the opposite sex category.
Here is the data for transwomen in female sports.
Here is the data for transmen in male sports.
More from All


ChatGPT is a phenomenal AI Tool.
But don't limit yourself to just ChatGPT.
Here're 8 AI-powered tools you should try in 2023:
1. KaiberAI
@KaiberAI helps you generate beautiful videos in minutes.
Transform your ideas into the visual stories of your dreams with this Amazing Tool.
New features:
1. Upload your custom music
2. Prompt Templates
3. Camera Movements:
Check here
https://t.co/ivnDRf628L

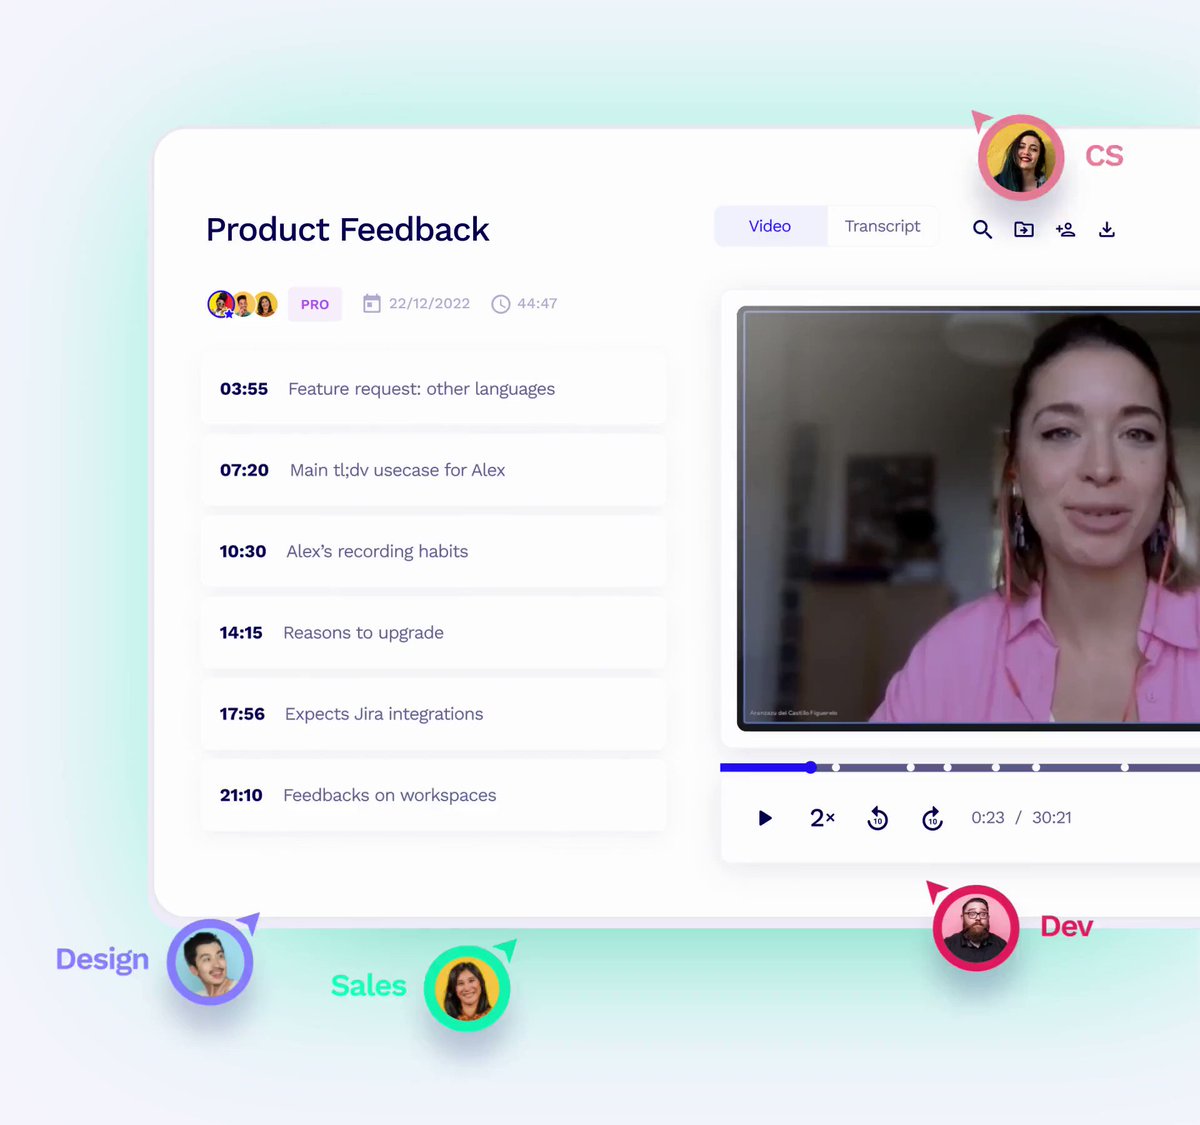
2. @tldview TLDV
Best ChatGPT Alternative for meetings.
Make your meetings 10X more productive with this amazing tool.
Try it now:
https://t.co/vOy3sS4QfJ
3. ComposeAI
Use ComposeAI for generating any text using AI.
It’s will help you write better content in seconds.
Try it here:
https://t.co/ksj5aop5ZI

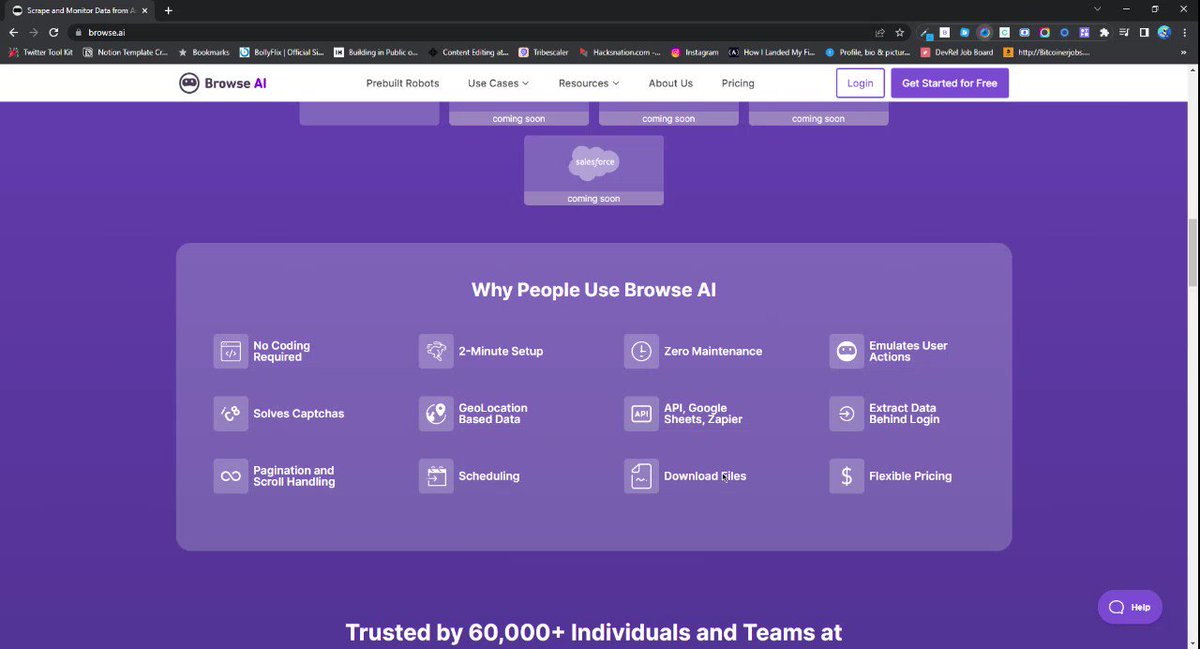
4. Browser AI
Use this AI tool to extract and monitor data from any website.
Train a robot in 2 minutes to do your work.
No coding required.
https://t.co/nNiawtUMyO
But don't limit yourself to just ChatGPT.
Here're 8 AI-powered tools you should try in 2023:
1. KaiberAI
@KaiberAI helps you generate beautiful videos in minutes.
Transform your ideas into the visual stories of your dreams with this Amazing Tool.
New features:
1. Upload your custom music
2. Prompt Templates
3. Camera Movements:
Check here
https://t.co/ivnDRf628L
2. @tldview TLDV
Best ChatGPT Alternative for meetings.
Make your meetings 10X more productive with this amazing tool.
Try it now:
https://t.co/vOy3sS4QfJ
3. ComposeAI
Use ComposeAI for generating any text using AI.
It’s will help you write better content in seconds.
Try it here:
https://t.co/ksj5aop5ZI
4. Browser AI
Use this AI tool to extract and monitor data from any website.
Train a robot in 2 minutes to do your work.
No coding required.
https://t.co/nNiawtUMyO
You May Also Like


1/ Here’s a list of conversational frameworks I’ve picked up that have been helpful.
Please add your own.
2/ The Magic Question: "What would need to be true for you
3/ On evaluating where someone’s head is at regarding a topic they are being wishy-washy about or delaying.
“Gun to the head—what would you decide now?”
“Fast forward 6 months after your sabbatical--how would you decide: what criteria is most important to you?”
4/ Other Q’s re: decisions:
“Putting aside a list of pros/cons, what’s the *one* reason you’re doing this?” “Why is that the most important reason?”
“What’s end-game here?”
“What does success look like in a world where you pick that path?”
5/ When listening, after empathizing, and wanting to help them make their own decisions without imposing your world view:
“What would the best version of yourself do”?
Please add your own.
2/ The Magic Question: "What would need to be true for you
1/\u201cWhat would need to be true for you to\u2026.X\u201d
— Erik Torenberg (@eriktorenberg) December 4, 2018
Why is this the most powerful question you can ask when attempting to reach an agreement with another human being or organization?
A thread, co-written by @deanmbrody: https://t.co/Yo6jHbSit9
3/ On evaluating where someone’s head is at regarding a topic they are being wishy-washy about or delaying.
“Gun to the head—what would you decide now?”
“Fast forward 6 months after your sabbatical--how would you decide: what criteria is most important to you?”
4/ Other Q’s re: decisions:
“Putting aside a list of pros/cons, what’s the *one* reason you’re doing this?” “Why is that the most important reason?”
“What’s end-game here?”
“What does success look like in a world where you pick that path?”
5/ When listening, after empathizing, and wanting to help them make their own decisions without imposing your world view:
“What would the best version of yourself do”?