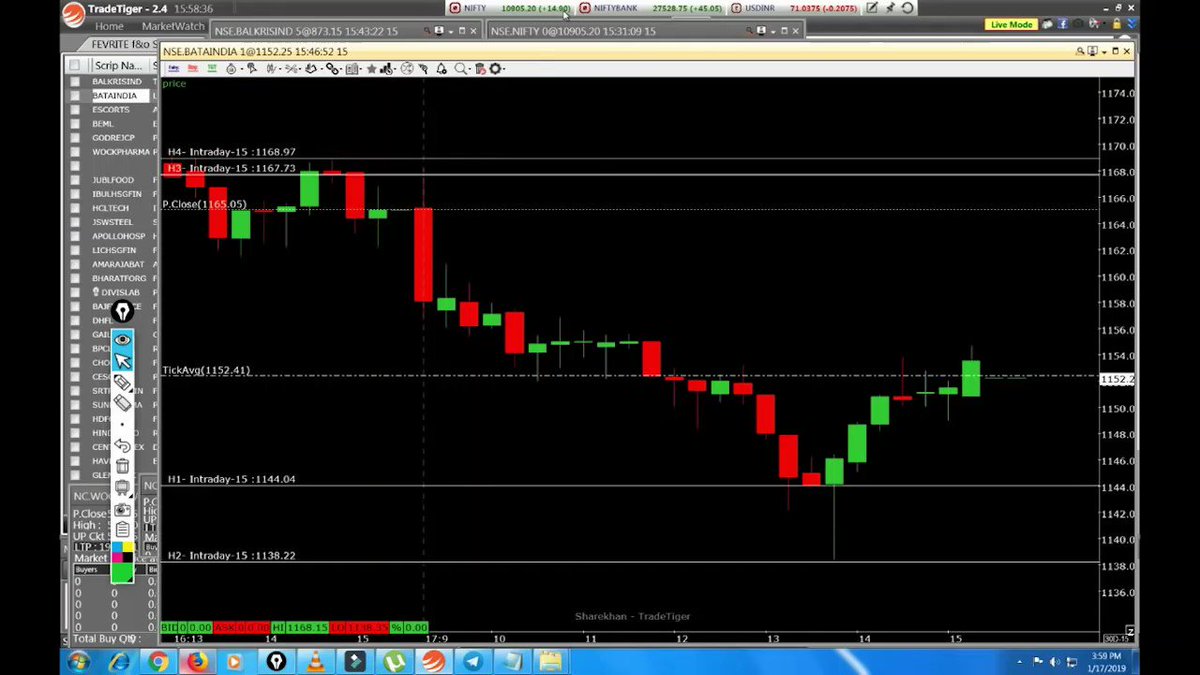
- If any Index closed exactly at the resistance, you can get a trade on either side on the next day. (2/11)
How you can filter stocks for Intraday trades - 🧵
As a kid, we would do homework before school the next day - you have to do homework here too. A specific sector performs on a particular day and studying things a day before will help you spot that particular sector. (1/11)
- If any Index closed exactly at the resistance, you can get a trade on either side on the next day. (2/11)
- If any Index closed exactly at support, you can get a trade on either side the following day.
- If there was a bullish signal at the support.
- If any Index gave a breakout or breakdown and then gave a good closing. (3/11)
Once you spot the Index, look at all the stocks in that particular Index. Pick at least 3-4 stocks from that Index and add them to your watchlist for the next day. It's ideal to check both higher and lower timeframes. (4/11)
- Start with checking the top gainers/losers list. I observe market from 9:15 to 9:45am to check the sectors performing well on that day.(5/11)
More from Sheetal Rijhwani
Students of @Mitesh_Engr are real gems on twitter!
Nobody will give you this kind of knowledge in any paid webinar like they gave this in a thread! One more brilliant thread by @ITRADE191 @AdityaTodmal @niki_poojary
Nobody will give you this kind of knowledge in any paid webinar like they gave this in a thread! One more brilliant thread by @ITRADE191 @AdityaTodmal @niki_poojary
In this thread, I'll walk you through my set up, absorb it as much as you can.
— itrade(DJ) (@ITRADE191) June 27, 2021
The instrument that I trade in are Nifty (NF) options
Thanks to @AdityaTodmal @niki_poojary for contributing in making this pic.twitter.com/BrMrGydb1v
If you're a swing/positional/trend follower, then this thread is for you. In this one, I will be covering how to filter stocks, how to take entry and the exit plans. 🧵 (1/21)
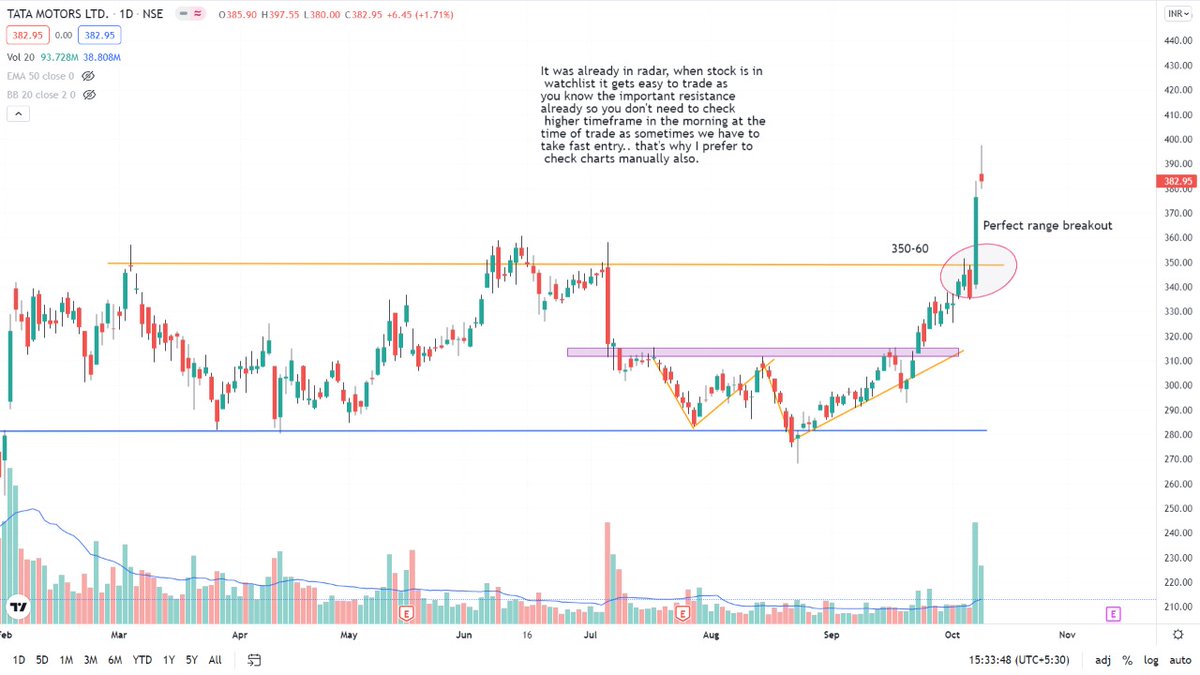
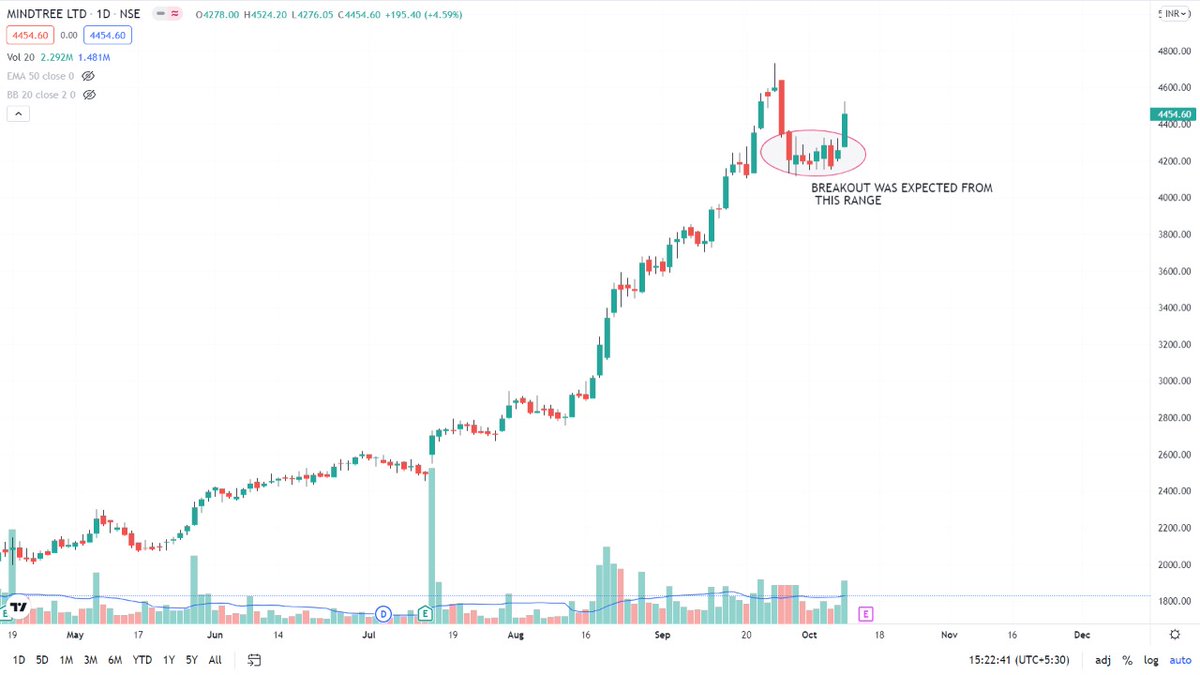
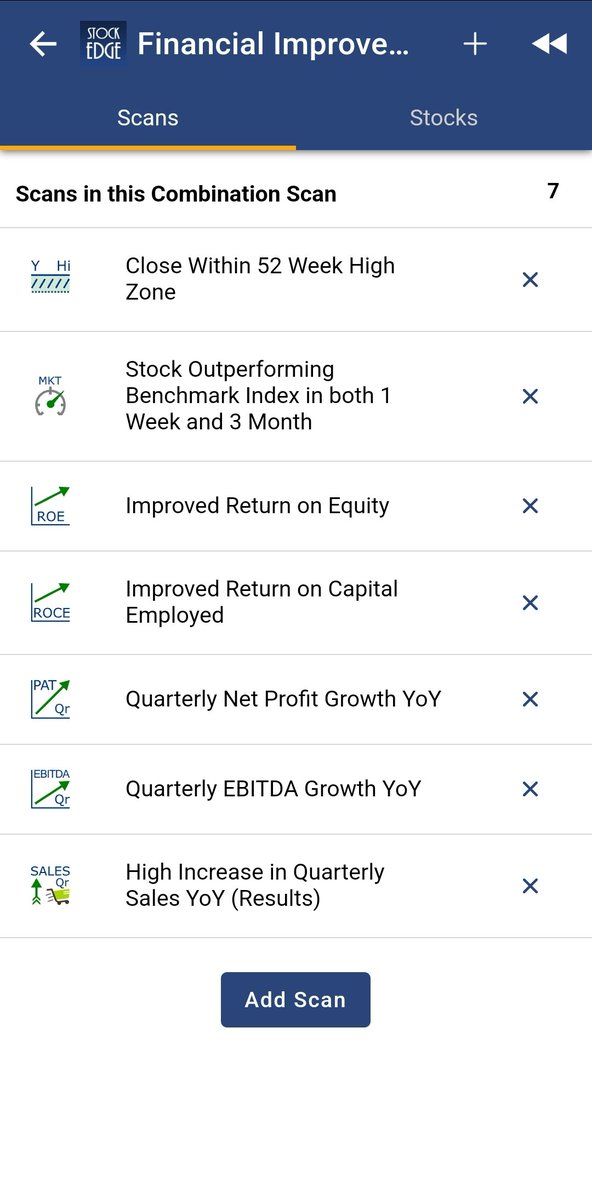
It's practically impossible to check all charts. However, you can use multiple scanners as per your setups to make things easy.
In trending market, even junk stocks give a good move. But in sideways and falling markets, you have to be very selective. (2/21)
One imp. filter for me is trading in strong fundamental stocks. Every quarter, I check results of companies and filter the list. I keep checking the charts and set an alert on the levels. Many good handles on Twitter post good results lists, you can save that as well. (3/21)
This time, I did the same on my telegram channel.
https://t.co/C3eS9PSncG
Second filter for me is Current Performing Sectors/Themes. Keep your eyes and ears open. Being a good observer helps you big time. Make good use of news in your analysis. (4/21)
For Eg: Textiles are performing well for a while now. It has strong consumer interest due to many global retailers, diversifying their outsourcing and reducing their dependence on China. Order booking from India has increased rapidly. (5/21)
More from Screeners
VWAP for intraday Trading Part -2
A small thread.
PART 1 - https://t.co/ooxepHpYKL
Traders show your support by like & retweet to benefit all
@Mitesh_Engr @ITRADE191 @ProdigalTrader @nakulvibhor @RajarshitaS @Puretechnicals9 @AnandableAnand @Anshi_________ @ca_mehtaravi

Chart 1
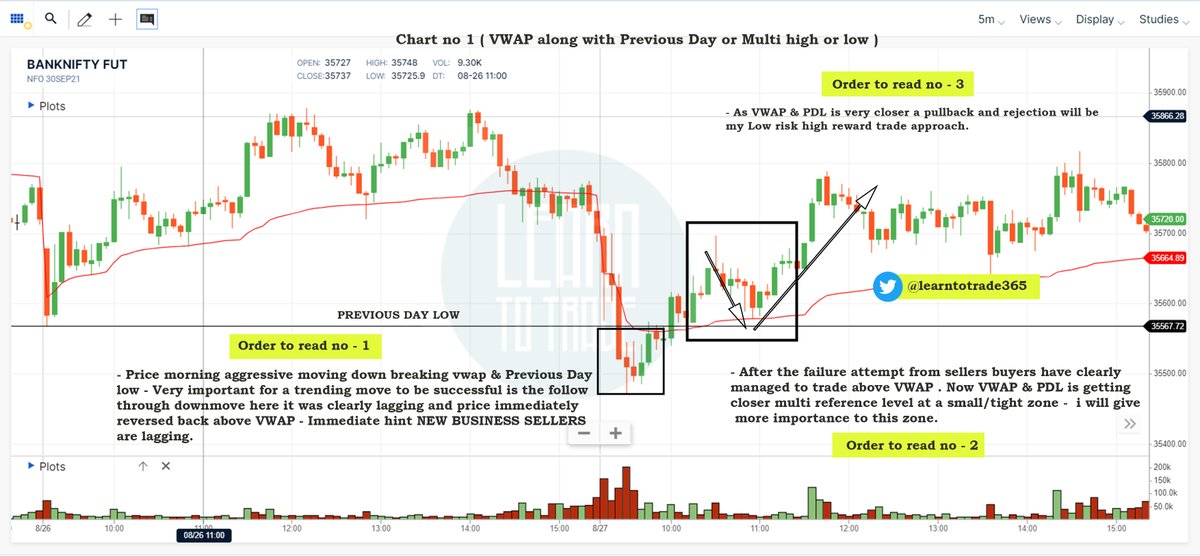
Chart 2
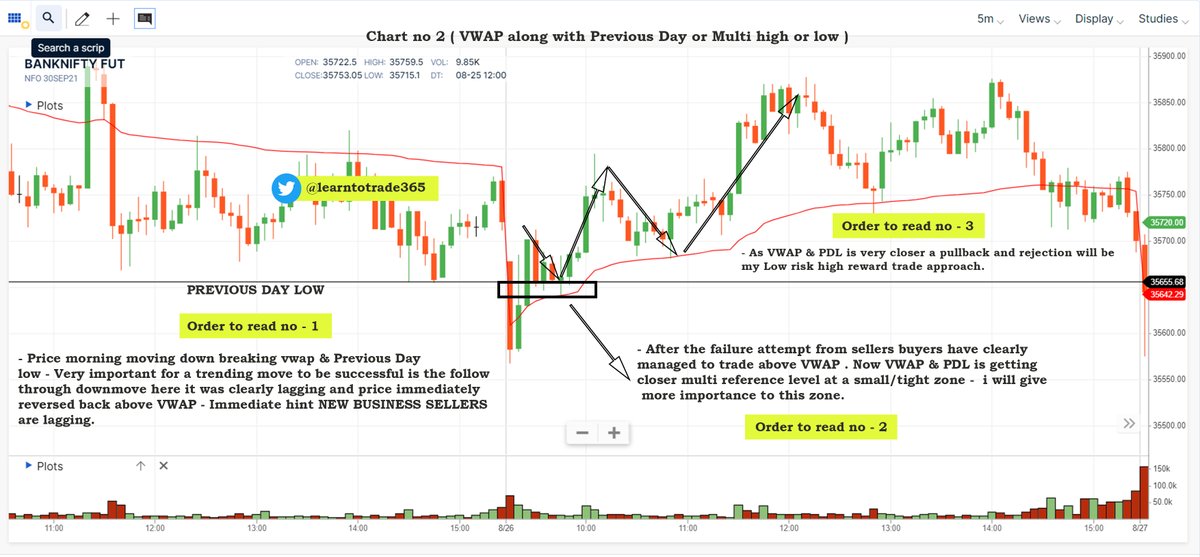
Chart 3
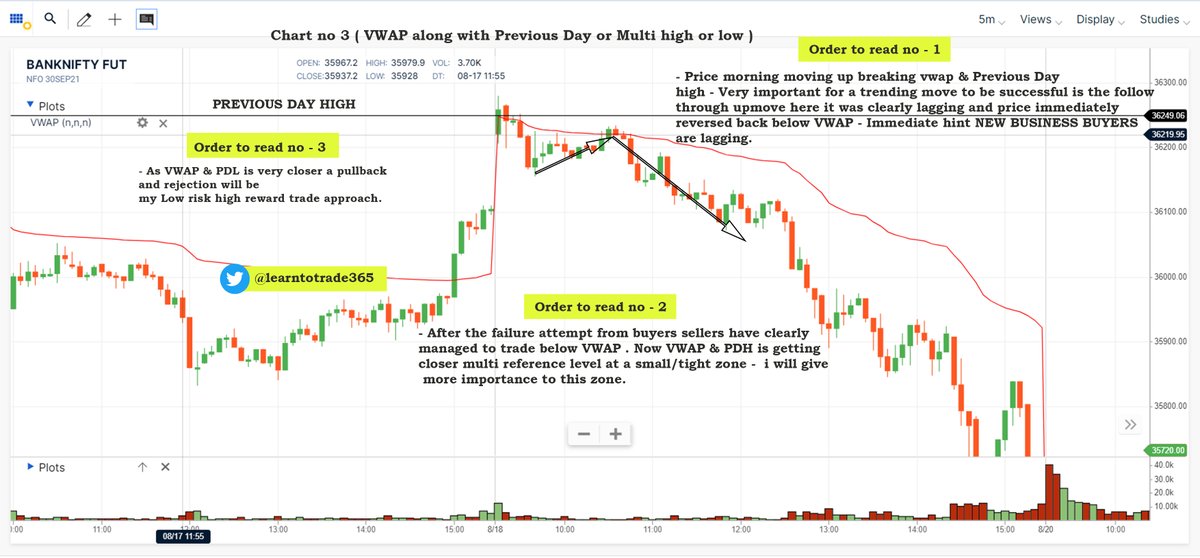
Chart 4
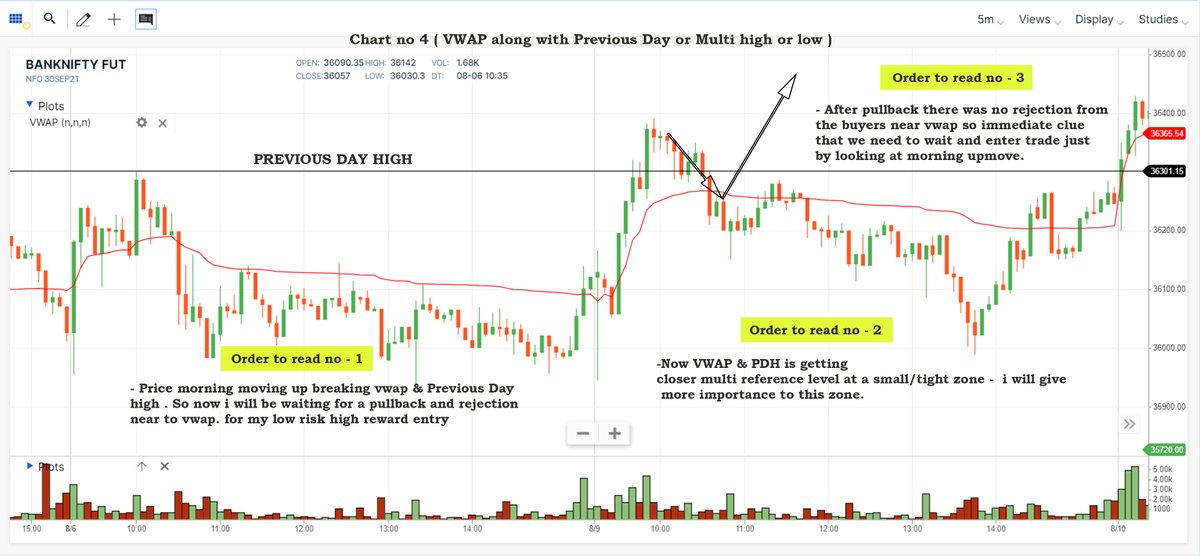
A small thread.
PART 1 - https://t.co/ooxepHpYKL
Traders show your support by like & retweet to benefit all
@Mitesh_Engr @ITRADE191 @ProdigalTrader @nakulvibhor @RajarshitaS @Puretechnicals9 @AnandableAnand @Anshi_________ @ca_mehtaravi

VWAP for intraday Trading Part -1
— Learn to Trade (@learntotrade365) August 28, 2021
A small thread PART -2 will be released tomorrow
Traders show your support by like & retweet to benefit all@Mitesh_Engr @ITRADE191 @ProdigalTrader @nakulvibhor @ArjunB9591 @CAPratik_INDIAN @RajarshitaS @Stockstudy8 @vivbajaj @Prakashplutus pic.twitter.com/y8bwisM4hB
Chart 1

Chart 2

Chart 3

Chart 4

Such opportunities only come once in a few years.
Step-by-step: how to use (the free) @screener_in to generate investment ideas.
Do retweet if you find it useful to benefit max investors. 🙏🙏
Ready or not, 🧵🧵⤵️

I will use the free screener version so that everyone can follow along.
Outline
1. Stepwise Guide
2. Practical Example: CoffeeCan Companies
3. Practical Example: Smallcap Consistent compounders
4. Practical Example: Smallcap turnaround
5. Key Takeaway
1. Stepwise Guide
Step1
Go to https://t.co/jtOL2Bpoys
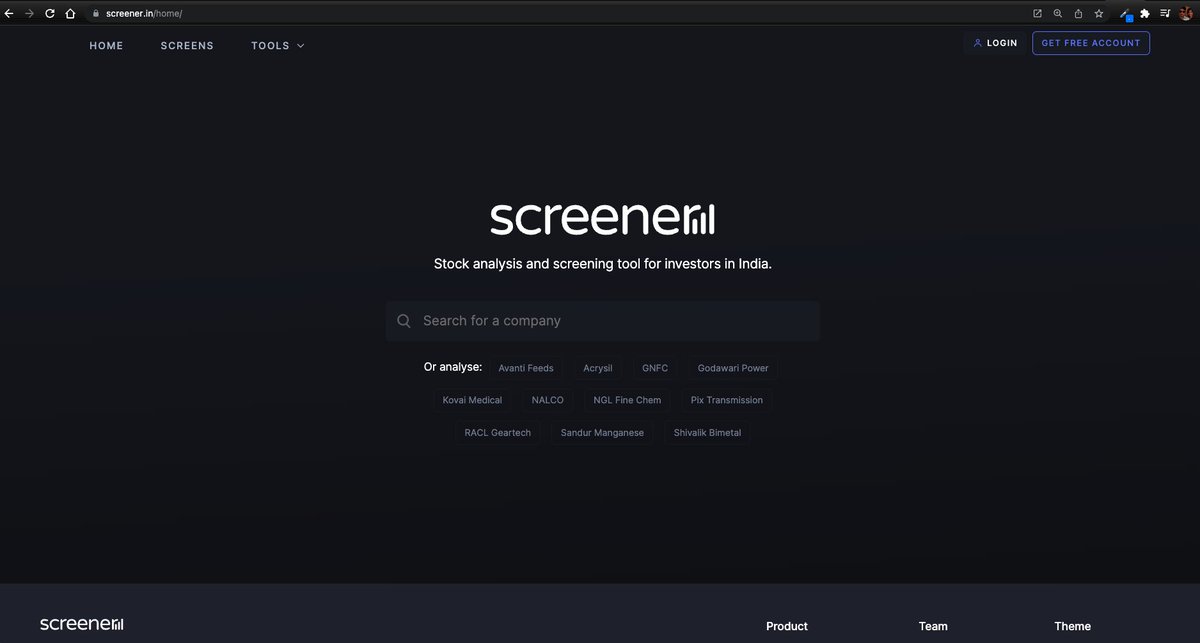
Step2
Go to "SCREENS" tab
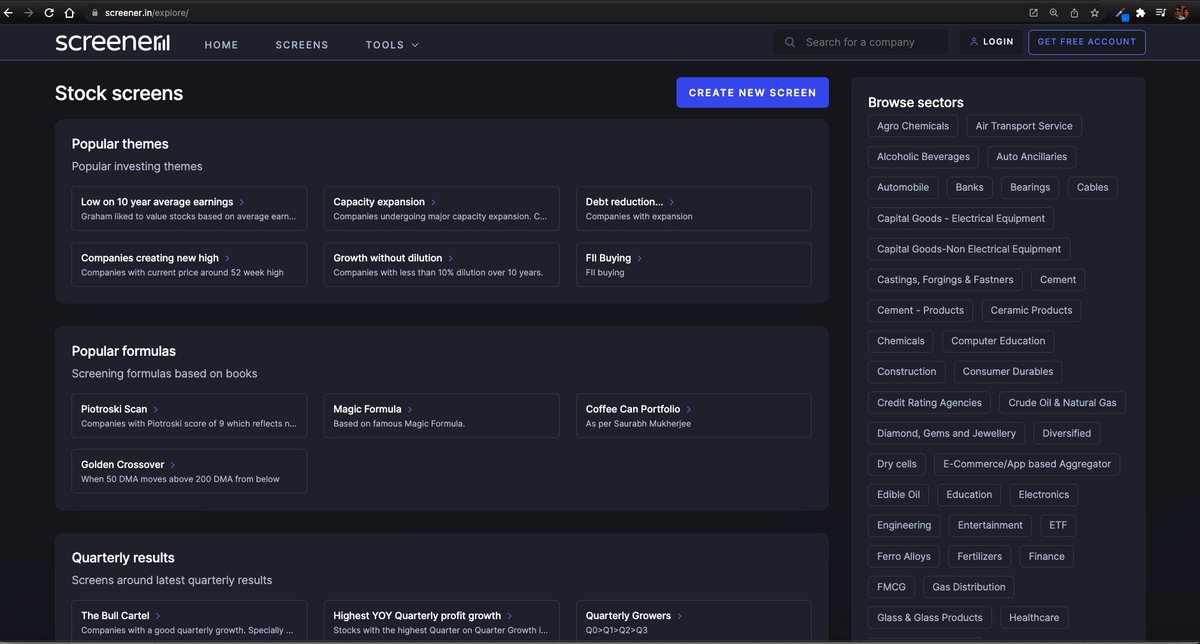
Step3
Go to "CREATE NEW SCREEN"
At this point you need to register. No charges. I did that with my brother's email id. This is what you see after that.

Step-by-step: how to use (the free) @screener_in to generate investment ideas.
Do retweet if you find it useful to benefit max investors. 🙏🙏
Ready or not, 🧵🧵⤵️

I will use the free screener version so that everyone can follow along.
Outline
1. Stepwise Guide
2. Practical Example: CoffeeCan Companies
3. Practical Example: Smallcap Consistent compounders
4. Practical Example: Smallcap turnaround
5. Key Takeaway
1. Stepwise Guide
Step1
Go to https://t.co/jtOL2Bpoys

Step2
Go to "SCREENS" tab

Step3
Go to "CREATE NEW SCREEN"
At this point you need to register. No charges. I did that with my brother's email id. This is what you see after that.

Took me 5 years to get the best Chartink scanners for Stock Market, but you’ll get it in 5 mminutes here ⏰
Do Share the above tweet 👆
These are going to be very simple yet effective pure price action based scanners, no fancy indicators nothing - hope you liked it.
https://t.co/JU0MJIbpRV
52 Week High
One of the classic scanners very you will get strong stocks to Bet on.
https://t.co/V69th0jwBr
Hourly Breakout
This scanner will give you short term bet breakouts like hourly or 2Hr breakout
Volume shocker
Volume spurt in a stock with massive X times


