Authors EquiAlpha -MidTerm Momentum🐎🐎
7 days
30 days
All time
Recent
Popular


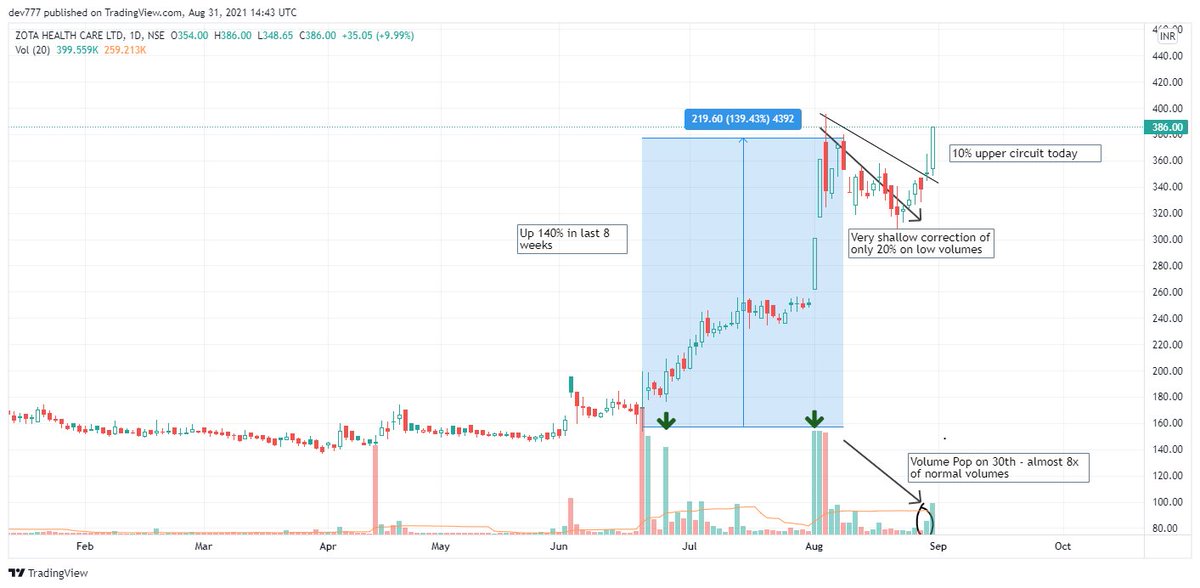
This is why I bought Zota Healthcare📜
> Super high buying pressure already up 140% in last 8 weeks + Volume activity
Funda - Co is in super speed opening DavaIndia generic medicine stores in south India
Details in chart below👇
Up 10% today 🚀
RT if you like the analysis ⚡️ https://t.co/hK0ZBLE6Bz
> Super high buying pressure already up 140% in last 8 weeks + Volume activity
Funda - Co is in super speed opening DavaIndia generic medicine stores in south India
Details in chart below👇
Up 10% today 🚀
RT if you like the analysis ⚡️ https://t.co/hK0ZBLE6Bz
Only zota healthcare \U0001f680\U0001f680\U0001f680\U0001f40e
— EquiAlpha -MidTerm Momentum\U0001f40e\U0001f40e (@equialpha) August 31, 2021
Masterstroke \U0001f4a5\U0001f4a5\U0001f4a5 pic.twitter.com/hnH22mtUJN


As I said yesterday, I will be sharing the some of my screeners in this thread 🐎
Please note Screener will help you to reach momentum but you need to see chart & further segregate trends manually (1/n)
Do retweet & like so that it reaches maximum people
Screener 1) +ve ADX DMI Breakout to find out where the action is going on a particular day, you can then look onto stocks and find setups and patterns to trade.
Link - https://t.co/fIKlWSloNw
(1/4)
Screener 2) Going one level more deep into ADX where we find up stocks which are already in trend on weekly
1) Weekly ADX >25 indicating the trend is already there
2) +DMI breaking out
3) Stock within 15% of 52w high
4) Stock above 200 SMA
Link-
Screener 3) This is based out of within 20% of ATH Stocks. I have also added few fundamentals to it. You can change variables according to it
Link -
Screener 4) RSI which is a momentum indicator
RSI breaking out can give you names where momentum is picking up and then you can look onto charts for buy points
Link -


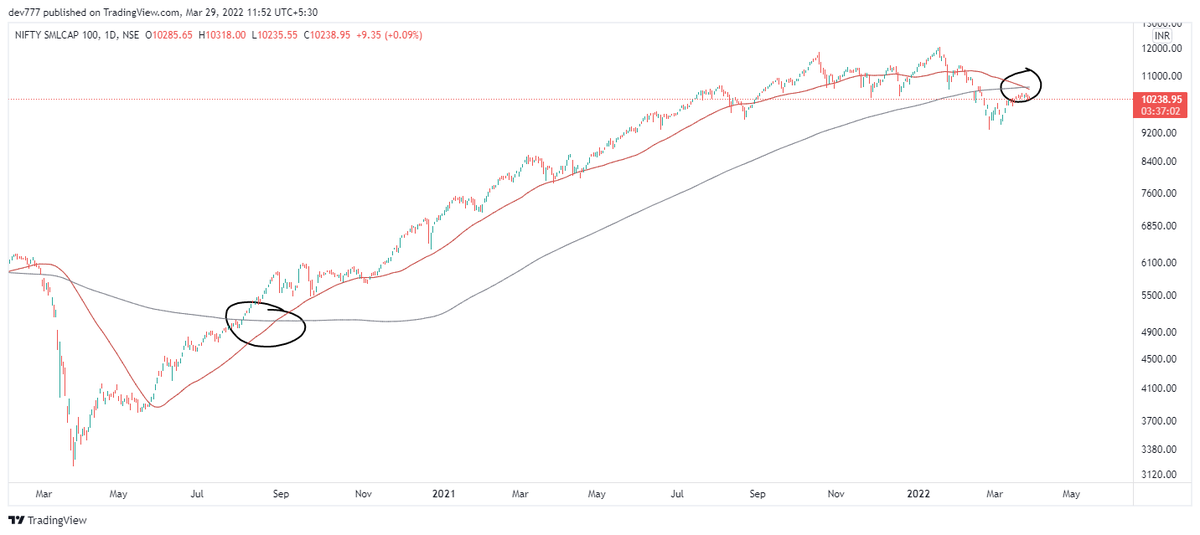
The other way to look at this is that..The stock went below 21 month EA in 2008 & 2020 crash
Something is happening really too bad and worst is yet to come for entire market !!
Something is happening really too bad and worst is yet to come for entire market !!
HDFC bank Monthly Chart :
— EquiAlpha -MidTerm Momentum\U0001f40e\U0001f40e (@equialpha) March 7, 2022
In last 20 years - Only 2 times the stock has gone below 21 month EMA as market. This seems the third time (Monthly close will confirm )
Don't know but something seems off !!
Lets check again on month end pic.twitter.com/9eeVfikdnU
3 Ways to ride a stock 🐎
(a thread) 🧵
>Do retweet if it adds value as this took a long time for me to make
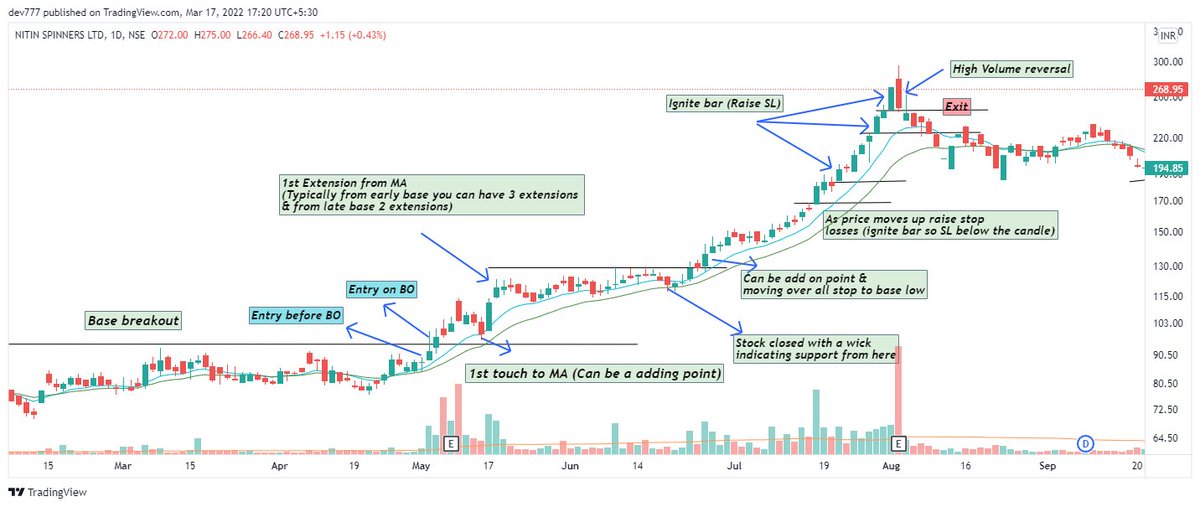
1) 10/20 Day EMA -
Enter the stock as it comes up back to the 10/20 day EMA and ride it till it drops below or SL hits as explained below
Eg -Nitin Spinners as below
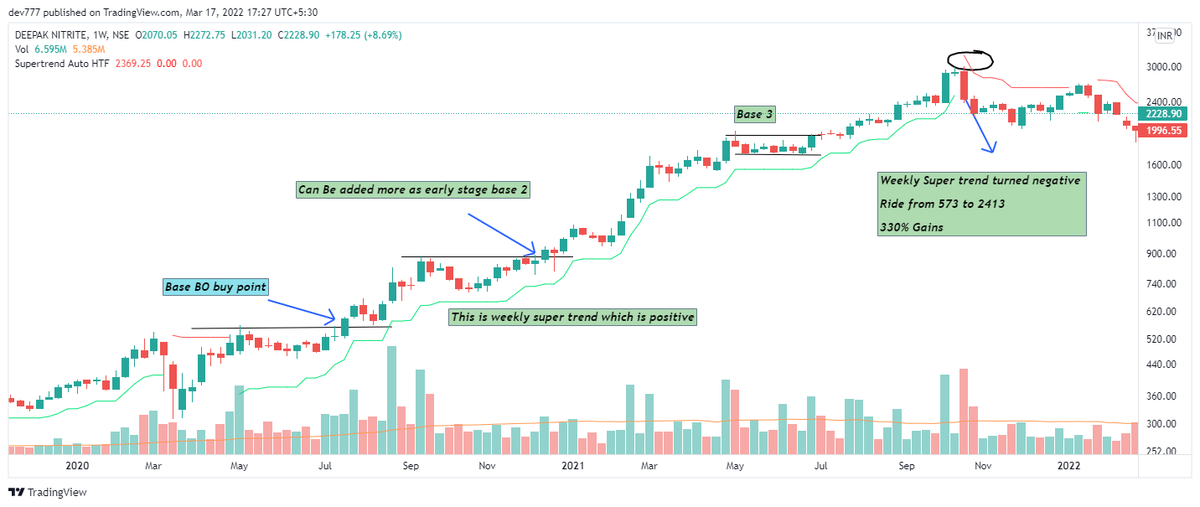
2) Weekly Super trend (Setting 2,7): Whenever trend changes , volatility increases & supertrend measures volatility..That's the logic behind it
Eg - Deepak Nitrite
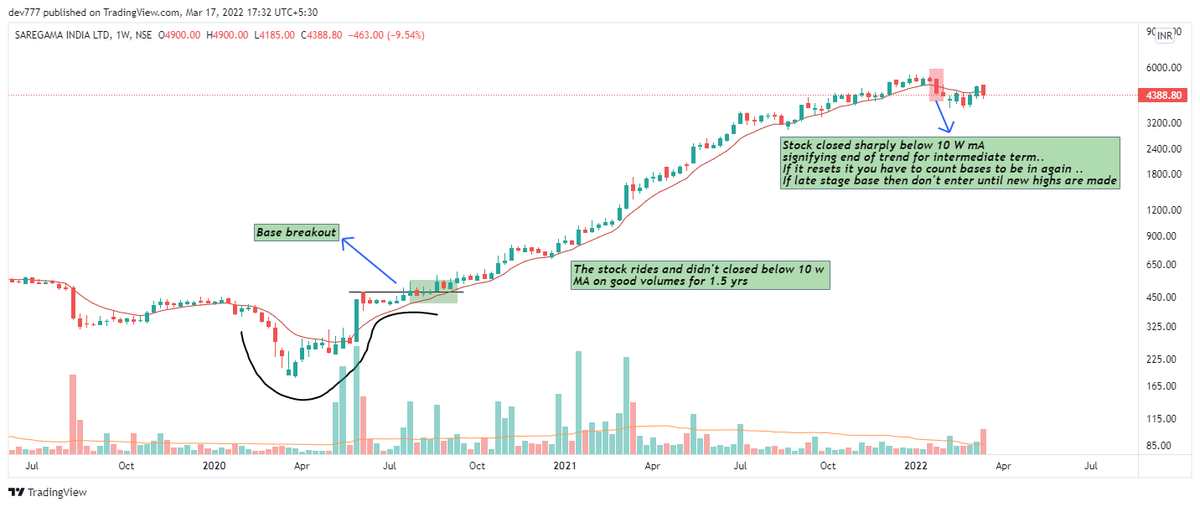
3) 10 Week MA : Trend following can be done using 10 w MA
Eg - Saregama
Fundamental analysis has to be done for best results as these are to be applied on a growing co + sector movt together ..Eg If you will apply to random co with low RS or low growth..This might be very choppy
Do retweet if make sense so as I can make more of such thread
Join telegram group for stock analysis & daily updates
https://t.co/lJ00OKEVd2
Download equialpha app for free momentum basics course
https://t.co/9N7vFDorC8
Thanks for reading.. Do like
(a thread) 🧵
>Do retweet if it adds value as this took a long time for me to make
1) 10/20 Day EMA -
Enter the stock as it comes up back to the 10/20 day EMA and ride it till it drops below or SL hits as explained below
Eg -Nitin Spinners as below
2) Weekly Super trend (Setting 2,7): Whenever trend changes , volatility increases & supertrend measures volatility..That's the logic behind it
Eg - Deepak Nitrite
3) 10 Week MA : Trend following can be done using 10 w MA
Eg - Saregama
Fundamental analysis has to be done for best results as these are to be applied on a growing co + sector movt together ..Eg If you will apply to random co with low RS or low growth..This might be very choppy
Do retweet if make sense so as I can make more of such thread
Join telegram group for stock analysis & daily updates
https://t.co/lJ00OKEVd2
Download equialpha app for free momentum basics course
https://t.co/9N7vFDorC8
Thanks for reading.. Do like