3 Common chart patterns guide 🧵

With examples

Do like & retweet👍

1) Cup & handle pattern : As name suggest it looks like a cup & handle. The cup is formed as stock corrects & then starts picking up again.

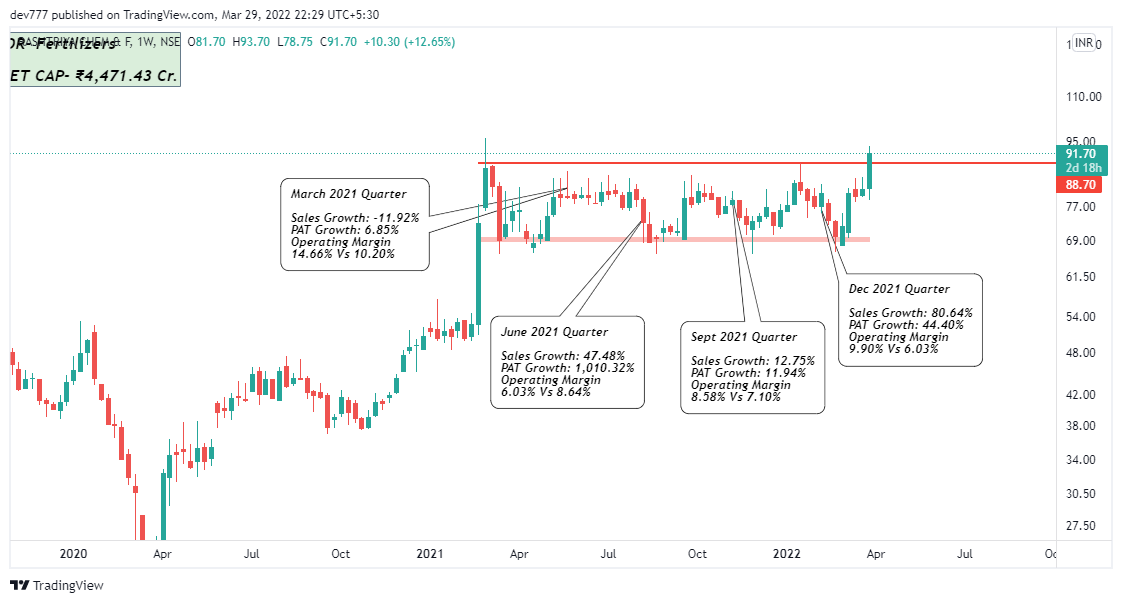
Handle formation is good process as it then digests the run leading to more sustained move. The specifics of cup above (1/n)
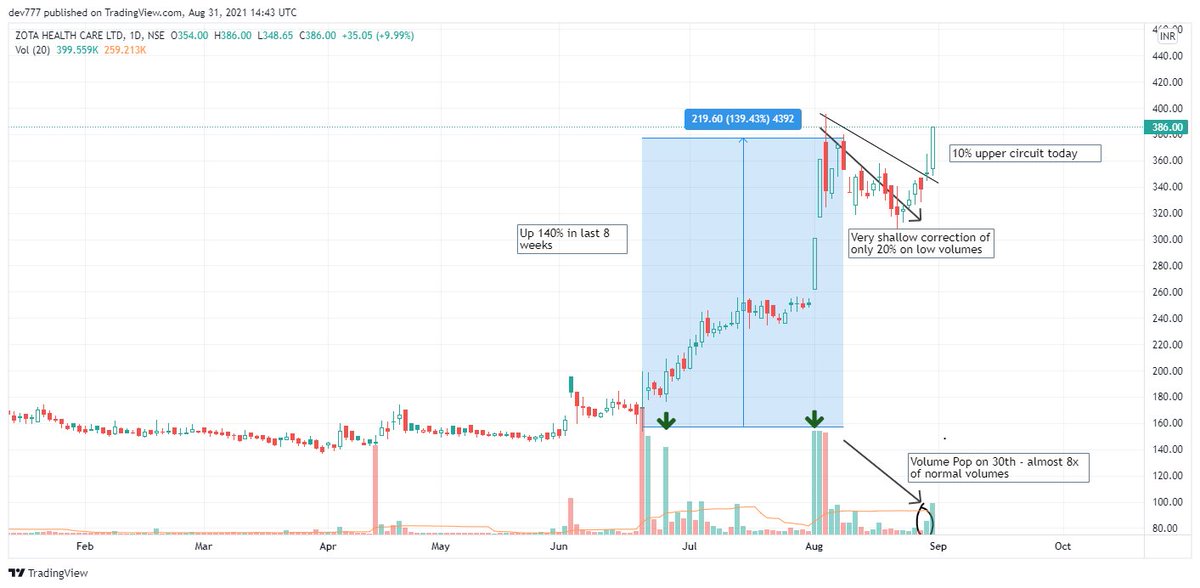
Note - The usual depth of a good cup is max 35% but if the market is coming out of deeper correction. Then the depth of cup can be 50-55% too. But in a bull market a correction more than 35% can result in faulty pattern with lots of overhead supply ..Examples below (2/n)
Examples - Deepak Nitrite, Dixon tech

TD Power System - Recent one ( Note the handle depth here is 19% . As compared to textbook handle this is more. I see upto 20% handles working) (3/n)
2) VCP - Typically volatility contraction is not a pattern but a characteristics of any pattern. You see deep handles >15/20% - you can say that its not a cup & handle ideally but a VCP which is also fine & will work. Reduced volatility is what traders want to move ahead (4/n)
Example of VCP & details explained in this video - https://t.co/g5nK817LuR
3rd Pattern - Triangle Pattern
> Stock forming lower highs but the lows are not breaking previous lows resulting in contraction of both sides and trendlines converge

> Sometimes the high becomes first high becomes the resistance. Examples below
Thanks for reading
Do join telegram for stock updates - https://t.co/lJ00OKnSb2

More from EquiAlpha- Price Cycle Trading

More from All

You May Also Like