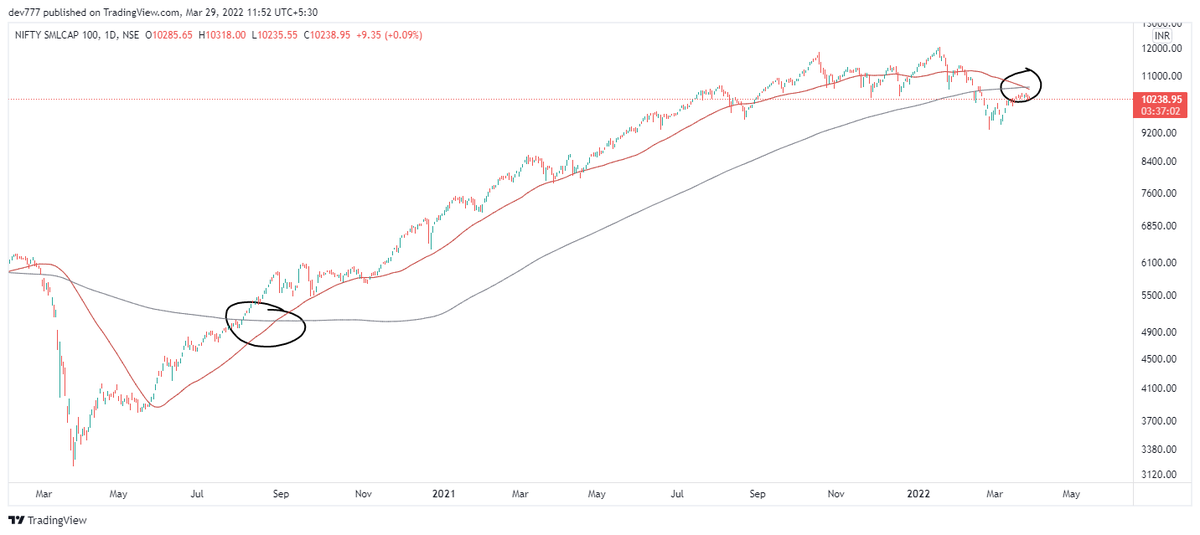
Do note : The 50 D SMA is crossing 200 D SMA from above for the 1st time since 20th August 2020
Usually the markets gets even more tougher after this & is prone to good fall
I have closed some positions near to cost due to the same..Let's see !
More from EquiAlpha -MidTerm Momentum🐎🐎
As I said yesterday, I will be sharing the some of my screeners in this thread 🐎
Please note Screener will help you to reach momentum but you need to see chart & further segregate trends manually (1/n)
Do retweet & like so that it reaches maximum people
Screener 1) +ve ADX DMI Breakout to find out where the action is going on a particular day, you can then look onto stocks and find setups and patterns to trade.
Link - https://t.co/fIKlWSloNw
(1/4)
Screener 2) Going one level more deep into ADX where we find up stocks which are already in trend on weekly
1) Weekly ADX >25 indicating the trend is already there
2) +DMI breaking out
3) Stock within 15% of 52w high
4) Stock above 200 SMA
Link-
Screener 3) This is based out of within 20% of ATH Stocks. I have also added few fundamentals to it. You can change variables according to it
Link -
Screener 4) RSI which is a momentum indicator
RSI breaking out can give you names where momentum is picking up and then you can look onto charts for buy points
Link -
Please note Screener will help you to reach momentum but you need to see chart & further segregate trends manually (1/n)
Do retweet & like so that it reaches maximum people
Screener 1) +ve ADX DMI Breakout to find out where the action is going on a particular day, you can then look onto stocks and find setups and patterns to trade.
Link - https://t.co/fIKlWSloNw
(1/4)
Screener 2) Going one level more deep into ADX where we find up stocks which are already in trend on weekly
1) Weekly ADX >25 indicating the trend is already there
2) +DMI breaking out
3) Stock within 15% of 52w high
4) Stock above 200 SMA
Link-
Screener 3) This is based out of within 20% of ATH Stocks. I have also added few fundamentals to it. You can change variables according to it
Link -
Screener 4) RSI which is a momentum indicator
RSI breaking out can give you names where momentum is picking up and then you can look onto charts for buy points
Link -
The other way to look at this is that..The stock went below 21 month EA in 2008 & 2020 crash
Something is happening really too bad and worst is yet to come for entire market !!
HDFC bank Monthly Chart :
— EquiAlpha -MidTerm Momentum\U0001f40e\U0001f40e (@equialpha) March 7, 2022
In last 20 years - Only 2 times the stock has gone below 21 month EMA as market. This seems the third time (Monthly close will confirm )
Don't know but something seems off !!
Lets check again on month end pic.twitter.com/9eeVfikdnU