
THE WAIT IS OVER🏆
FREE course on Momentum Trading Basics 🔥
Link - https://t.co/byW2cPH1xY
Note - This is a compilation of my all best strategy content out there on various platforms in Hindi + English
Do retweet for max benefit ✅
More from EquiAlpha -MidTerm Momentum🐎🐎
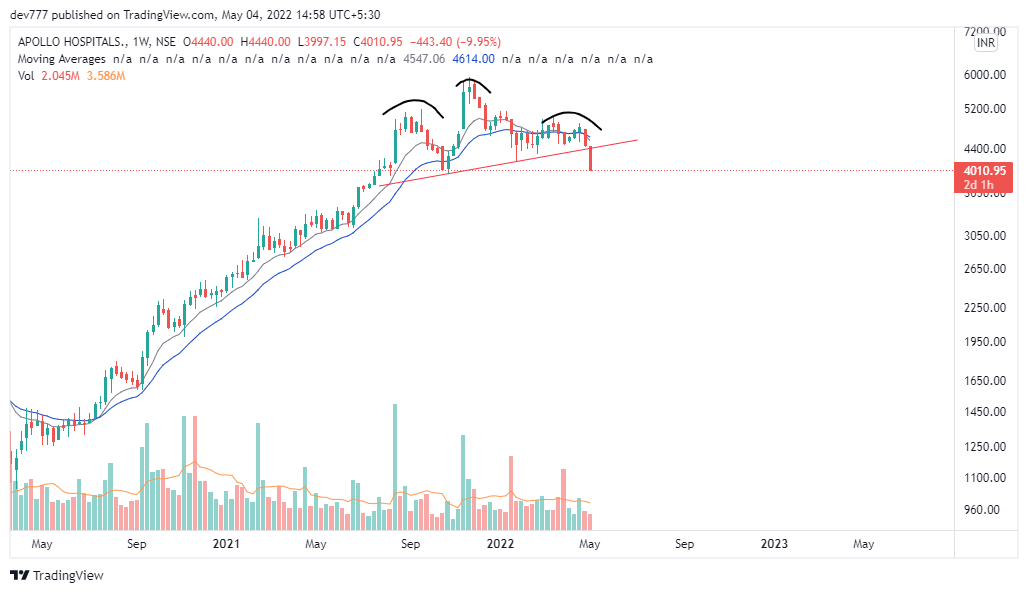
Something is happening really too bad and worst is yet to come for entire market !!
HDFC bank Monthly Chart :
— EquiAlpha -MidTerm Momentum\U0001f40e\U0001f40e (@equialpha) March 7, 2022
In last 20 years - Only 2 times the stock has gone below 21 month EMA as market. This seems the third time (Monthly close will confirm )
Don't know but something seems off !!
Lets check again on month end pic.twitter.com/9eeVfikdnU


More from Screeners


#bearrun
#BearMarket
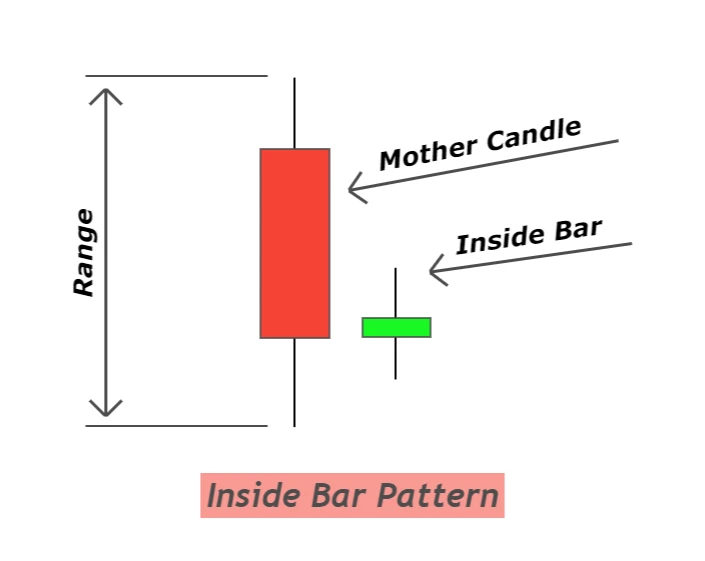
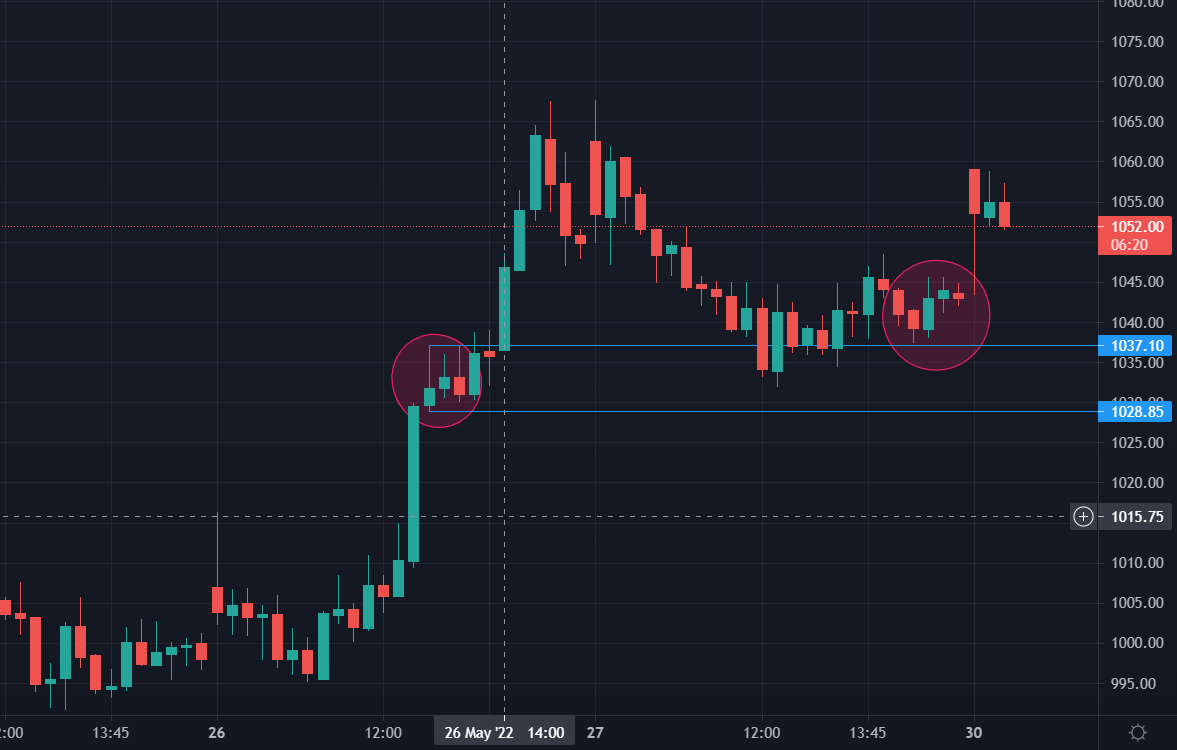
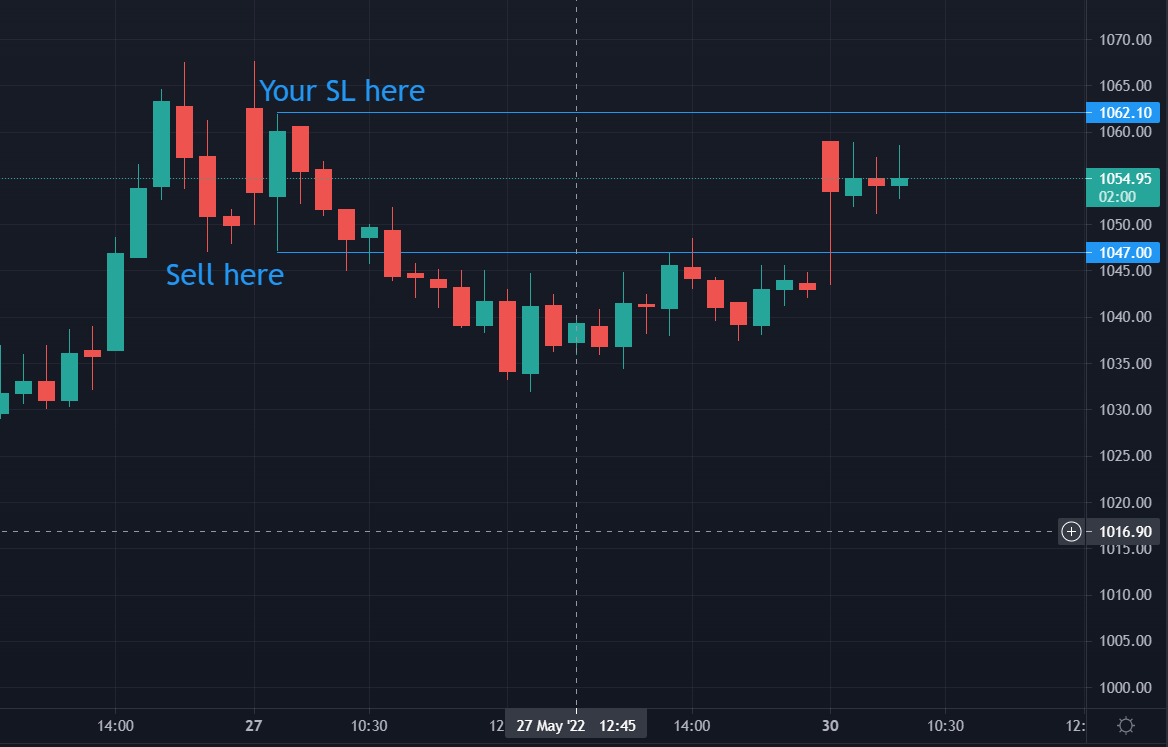
Head & Shoulders pattern, double top and bearish RSI divergences fail more often in bull market and generally gives a very good SAR trade. Vice versa is also true for bear market.#bullrun #BullMarket
— Aakash Gangwar (@akashgngwr823) February 9, 2021


You May Also Like








Ironies of Luck https://t.co/5BPWGbAxFi
— Morgan Housel (@morganhousel) March 14, 2018
"Luck is the flip side of risk. They are mirrored cousins, driven by the same thing: You are one person in a 7 billion player game, and the accidental impact of other people\u2019s actions can be more consequential than your own."
I’ve always felt that the luckiest people I know had a talent for recognizing circumstances, not of their own making, that were conducive to a favorable outcome and their ability to quickly take advantage of them.
In other words, dumb luck was just that, it required no awareness on the person’s part, whereas “smart” luck involved awareness followed by action before the circumstances changed.
So, was I “lucky” to be born when I was—nothing I had any control over—and that I came of age just as huge databases and computers were advancing to the point where I could use those tools to write “What Works on Wall Street?” Absolutely.
Was I lucky to start my stock market investments near the peak of interest rates which allowed me to spend the majority of my adult life in a falling rate environment? Yup.

RT-PCR corona (test) scam
Symptomatic people are tested for one and only one respiratory virus. This means that other acute respiratory infections are reclassified as
4/10
— Dr. Thomas Binder, MD (@Thomas_Binder) October 22, 2020
...indication, first of all that testing for a (single) respiratory virus is done outside of surveillance systems or need for specific therapy, but even so the lack of consideration of Ct, symptoms and clinical findings when interpreting its result. https://t.co/gHH6kwRdZG
2/12
It is tested exquisitely with a hypersensitive non-specific RT-PCR test / Ct >35 (>30 is nonsense, >35 is madness), without considering Ct and clinical context. This means that more acute respiratory infections are reclassified as
6/10
— Dr. Thomas Binder, MD (@Thomas_Binder) October 22, 2020
The neither validated nor standardised hypersensitive RT-PCR test / Ct 35-45 for SARS-CoV-2 is abused to mislabel (also) other diseases, especially influenza, as COVID-19.https://t.co/AkFIfTCTkS
3/12
The Drosten RT-PCR test is fabricated in a way that each country and laboratory perform it differently at too high Ct and that the high rate of false positives increases massively due to cross-reaction with other (corona) viruses in the "flu
External peer review of the RTPCR test to detect SARS-CoV-2 reveals 10 major scientific flaws at the molecular and methodological level: consequences for false positive results.https://t.co/mbNY8bdw1p pic.twitter.com/OQBD4grMth
— Dr. Thomas Binder, MD (@Thomas_Binder) November 29, 2020
4/12
Even asymptomatic, previously called healthy, people are tested (en masse) in this way, although there is no epidemiologically relevant asymptomatic transmission. This means that even healthy people are declared as COVID
Thread web\u2b06\ufe0f\u2b07\ufe0f
— Dr. Thomas Binder, MD (@Thomas_Binder) December 16, 2020
The fabrication of the "asymptomatic (super) spreader" is the coronation of the total nons(ci)ense in the belief system of #CoronasWitnesses.
Asymptomatic transmission 0.7%; 95% CI 0%-4.9% - could well be 0%!https://t.co/VeZTzxXfvT
5/12
Deaths within 28 days after a positive RT-PCR test from whatever cause are designated as deaths WITH COVID. This means that other causes of death are reclassified as
8/8
— Dr. Thomas Binder, MD (@Thomas_Binder) March 24, 2020
By the way, who the f*** created this obviously (almost) worldwide definition of #CoronaDeath?
This is not only medical malpractice, this is utterly insane!https://t.co/FFsTx4L2mw