More from EquiAlpha -MidTerm Momentum🐎🐎


Har stock turn down hota hai ! Exiting helps beating markets & catching new ones
Without rules you cannot conquer markets !
— EquiAlpha -MidTerm Momentum\U0001f40e\U0001f40e (@equialpha) May 3, 2022
These are my 9 sell warriors to conquer markets !
Selling is the toughest part..Some or the other sell rule always get me out !
Learn fully - https://t.co/iDlVff5KoU pic.twitter.com/u2vQvpGzEs
(a thread) 🧵
>Do retweet if it adds value as this took a long time for me to make
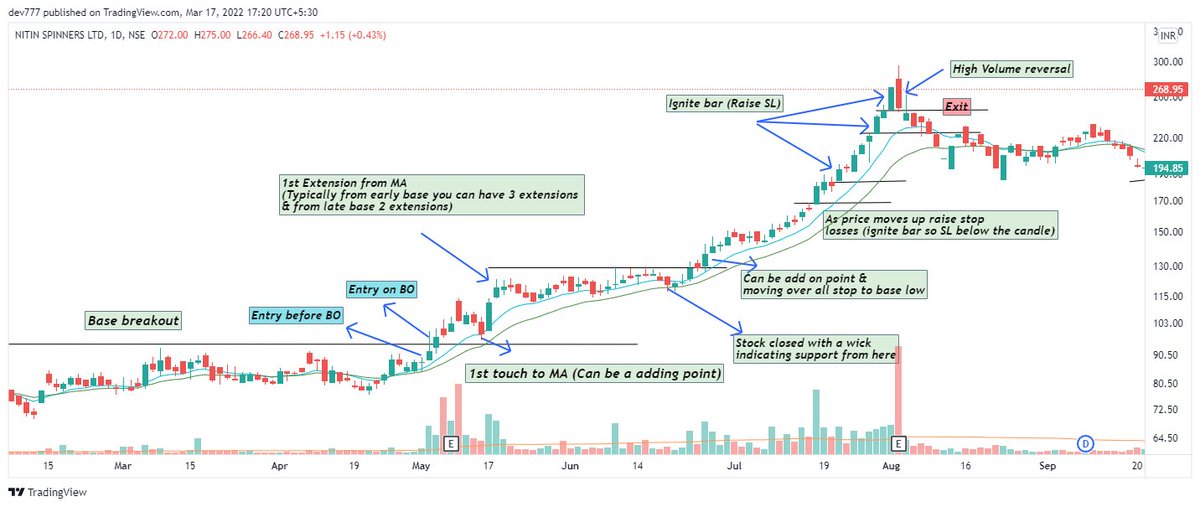
1) 10/20 Day EMA -
Enter the stock as it comes up back to the 10/20 day EMA and ride it till it drops below or SL hits as explained below
Eg -Nitin Spinners as below
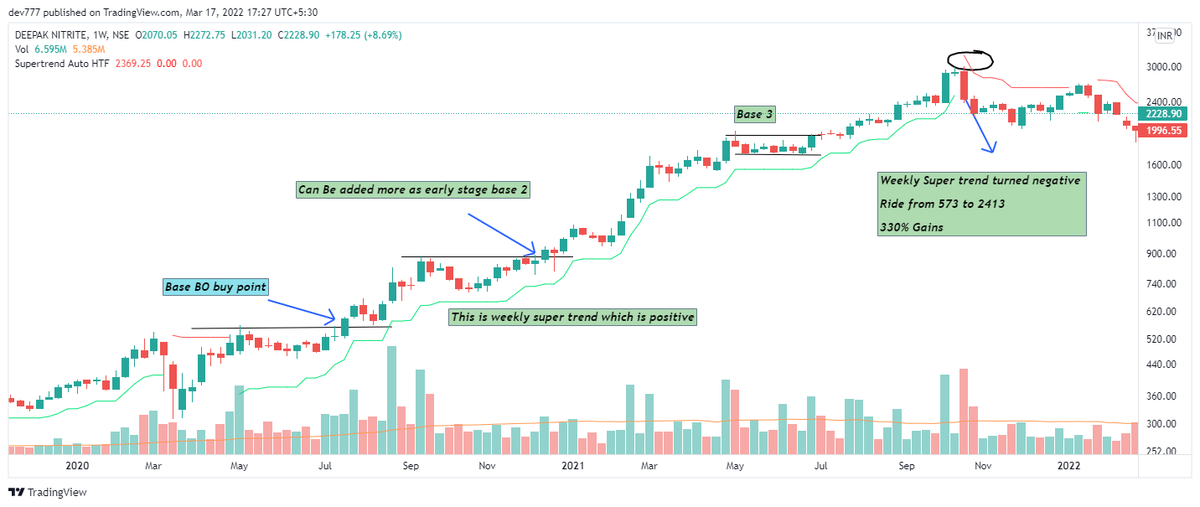
2) Weekly Super trend (Setting 2,7): Whenever trend changes , volatility increases & supertrend measures volatility..That's the logic behind it
Eg - Deepak Nitrite
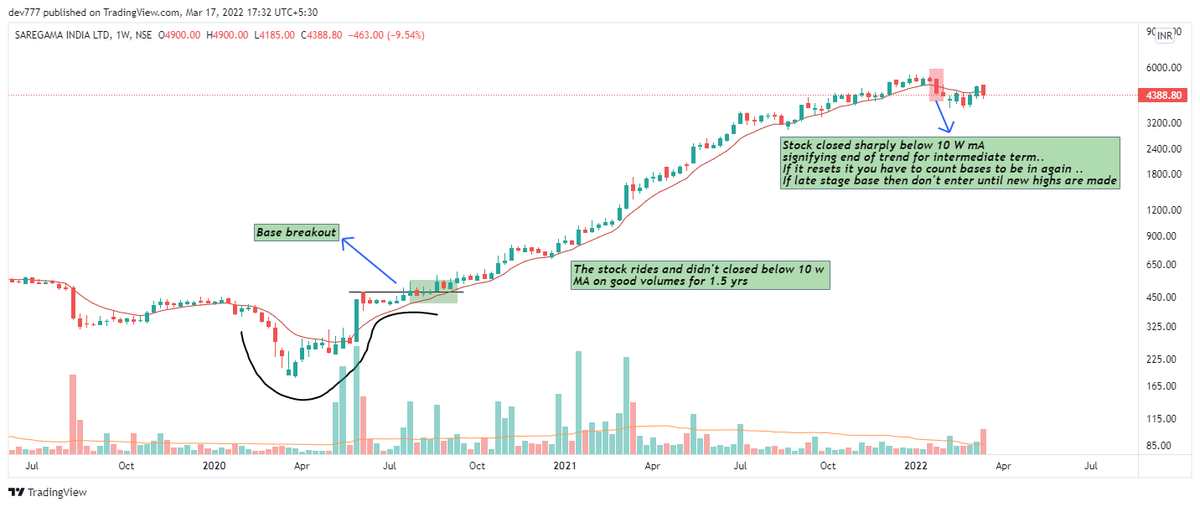
3) 10 Week MA : Trend following can be done using 10 w MA
Eg - Saregama
Fundamental analysis has to be done for best results as these are to be applied on a growing co + sector movt together ..Eg If you will apply to random co with low RS or low growth..This might be very choppy
Do retweet if make sense so as I can make more of such thread
Join telegram group for stock analysis & daily updates
https://t.co/lJ00OKEVd2
Download equialpha app for free momentum basics course
https://t.co/9N7vFDorC8
Thanks for reading.. Do like
More from Hdfcbank



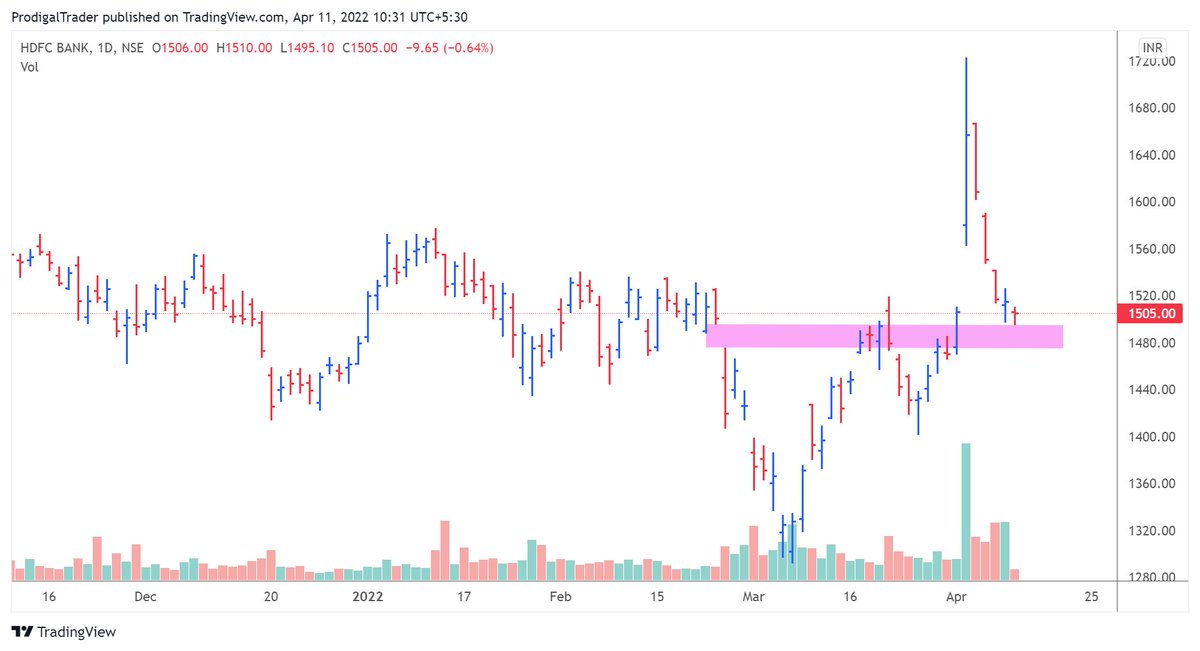
Something is happening really too bad and worst is yet to come for entire market !!
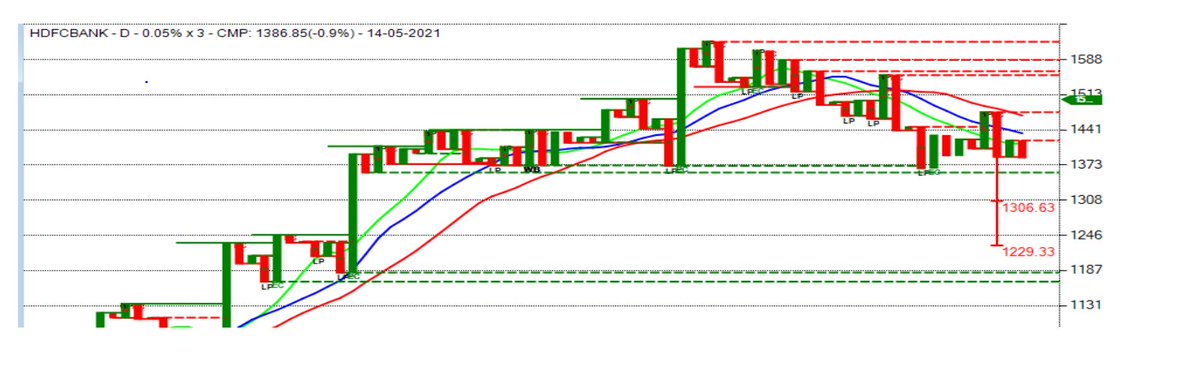
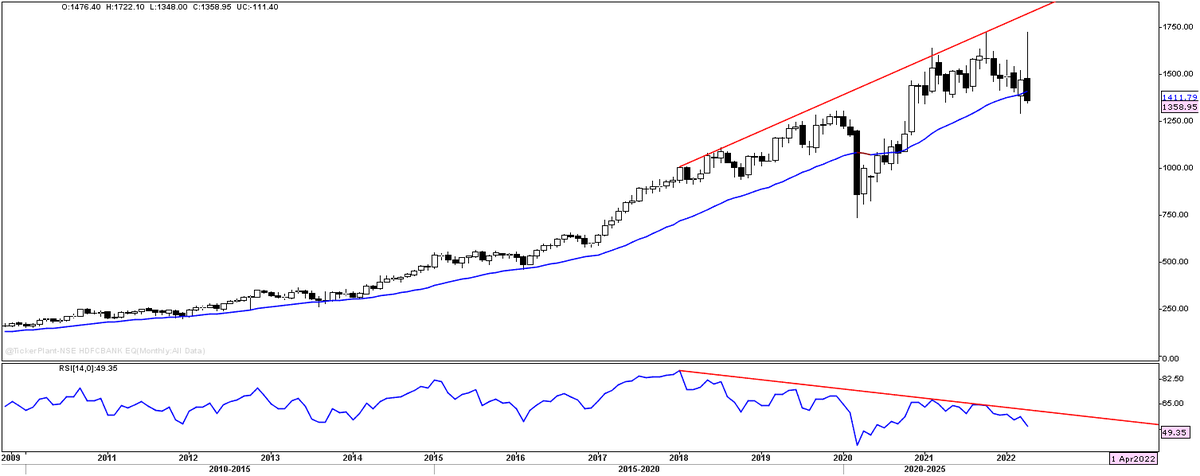
HDFC bank Monthly Chart :
— EquiAlpha -MidTerm Momentum\U0001f40e\U0001f40e (@equialpha) March 7, 2022
In last 20 years - Only 2 times the stock has gone below 21 month EMA as market. This seems the third time (Monthly close will confirm )
Don't know but something seems off !!
Lets check again on month end pic.twitter.com/9eeVfikdnU

You May Also Like




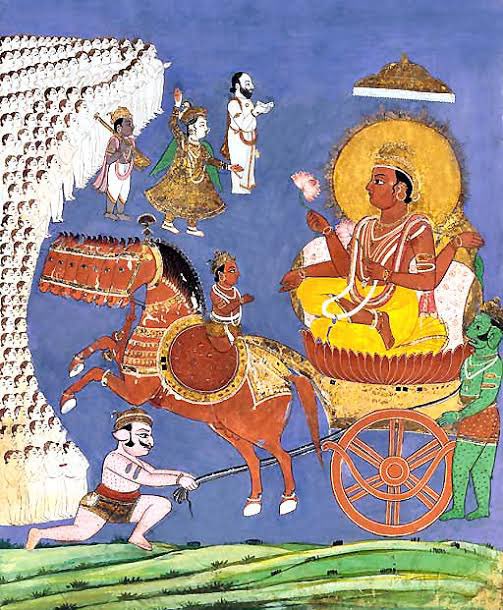
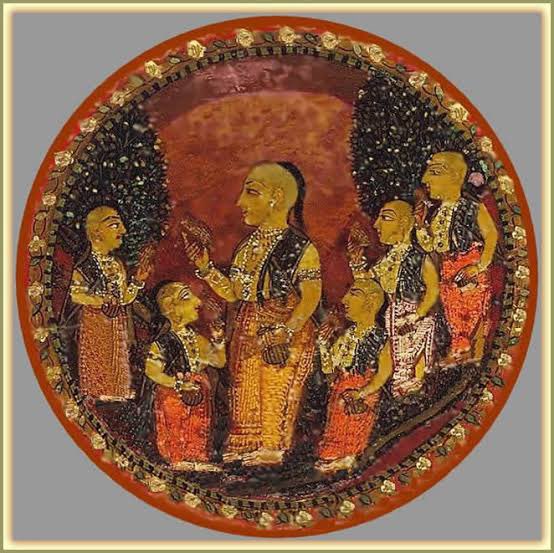
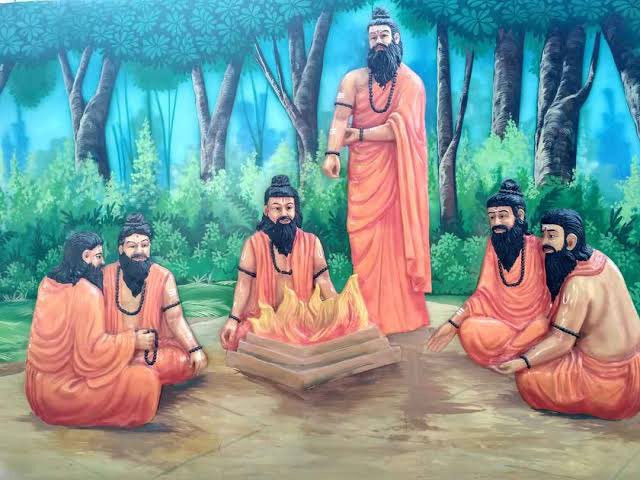

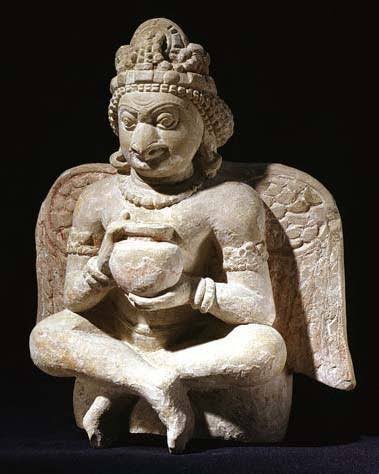

It was Ved Vyas who edited the eighteen thousand shlokas of Bhagwat. This book destroys all your sins. It has twelve parts which are like kalpvraksh.
In the first skandh, the importance of Vedvyas
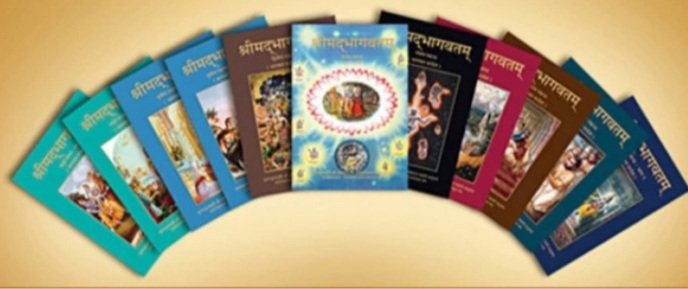
and characters of Pandavas are described by the dialogues between Suutji and Shaunakji. Then there is the story of Parikshit.
Next there is a Brahm Narad dialogue describing the avtaar of Bhagwan. Then the characteristics of Puraan are mentioned.
It also discusses the evolution of universe.( https://t.co/2aK1AZSC79 )
Next is the portrayal of Vidur and his dialogue with Maitreyji. Then there is a mention of Creation of universe by Brahma and the preachings of Sankhya by Kapil Muni.
HOW LIFE EVOLVED IN THIS UNIVERSE AS PER OUR SCRIPTURES.
— Anshul Pandey (@Anshulspiritual) August 29, 2020
Well maximum of Living being are the Vansaj of Rishi Kashyap. I have tried to give stories from different-different Puran. So lets start.... pic.twitter.com/MrrTS4xORk
In the next section we find the portrayal of Sati, Dhruv, Pruthu, and the story of ancient King, Bahirshi.
In the next section we find the character of King Priyavrat and his sons, different types of loks in this universe, and description of Narak. ( https://t.co/gmDTkLktKS )
Thread on NARK(HELL) / \u0928\u0930\u094d\u0915
— Anshul Pandey (@Anshulspiritual) August 11, 2020
Well today i will take you to a journey where nobody wants to go i.e Nark. Hence beware of doing Adharma/Evil things. There are various mentions in Puranas about Nark, But my Thread is only as per Bhagwat puran(SS attached in below Thread)
1/8 pic.twitter.com/raHYWtB53Q
In the sixth part we find the portrayal of Ajaamil ( https://t.co/LdVSSNspa2 ), Daksh and the birth of Marudgans( https://t.co/tecNidVckj )
In the seventh section we find the story of Prahlad and the description of Varnashram dharma. This section is based on karma vaasna.
#THREAD
— Anshul Pandey (@Anshulspiritual) August 12, 2020
WHY PARENTS CHOOSE RELIGIOUS OR PARAMATMA'S NAMES FOR THEIR CHILDREN AND WHICH ARE THE EASIEST WAY TO WASH AWAY YOUR SINS.
Yesterday I had described the types of Naraka's and the Sin or Adharma for a person to be there.
1/8 pic.twitter.com/XjPB2hfnUC