Authors Yash Mehta


This learning thread would be on
"𝙐𝙨𝙚𝙨 𝙤𝙛 𝙍𝙚𝙡𝙖𝙩𝙞𝙫𝙚 𝙎𝙩𝙧𝙚𝙣𝙜𝙩𝙝"
Shared some strategy.
Like👍 & Retweet🔄for wider reach and for more such learning thread in the future.
1/22
Most of us would confuse it with Relative Strength Index (RSI) but Relative Strength is a different indicator.
We have already covered about "Uses of RSI" in below thread👇
https://t.co/oTOrW7joNI
One can go through this if you haven't.
2/22
#RSI is a common indicator which most of us use in the stock market.
— Yash Mehta (@YMehta_) October 22, 2021
This learning thread would be on
"\U0001d650\U0001d668\U0001d65a\U0001d668 \U0001d664\U0001d65b \U0001d64d\U0001d64e\U0001d644"
Like\U0001f44d & Retweet\U0001f504 for wider reach and for more such learning thread in the future.
Also, an investment strategy is shared using RSI in the end.
1/16
Now coming to Relative Strength (RS).
It is basically a strategy used in momentum investing which shows strength or weakness between two asset classes (two stocks, index, commodity).
One can read about this in below
As of now, I am using this indicator on .@tradingview platform.
It's free and one can add it in their Tradingview account as well, using this link👇
https://t.co/FxCjJFsNOG
There are multiple variants in this as well. Some traders use multiple time frame RS.
4/22
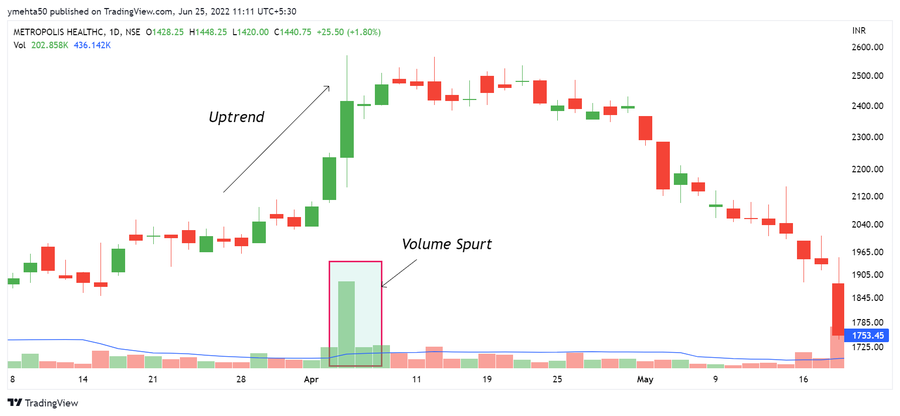
RS basically compares returns of one stock/index with the returns of benchmark stock/index at a particular time horizon.
Let's say, I want to analyze TCS and Benchmark Index is Nifty.
5/22


Creating this master thread of all the screeners that are shared on Twitter.
Save this as it can help traders a lot.
1/ Positional Trading Screener:
Shared 8 screeners that are based on different strategies for positional
Stock Screeners is an integral part of doing homework post market hours.
— Yash Mehta (@YMehta_) August 5, 2022
Most of us use screeners to filter buzzing stocks out of 1000+ stock and it saves lot of times.
Here is the list of top screeners:
Also, last screener is one of my favourite to pick early momentum stocks.
2/ Price Action Screener:
Shared 9 screeners that a Price Action trader can use in their
Screeners helps trader in saving lot of time in filtering best stocks out of 1000+ stocks listed.
— Yash Mehta (@YMehta_) September 16, 2022
Here is the list of top 9 Free Price Action based screeners that I use:
Also, last screener is my favorite to pick early momentum stocks.
3/ Indicator Strategy based Screener:
Shared 7 screeners that is based on Indicator based trading
Screeners helps trader in saving lot of time in filtering best stocks out of 5000+ listed stocks.
— Yash Mehta (@YMehta_) October 7, 2022
Here is the list of top 7 Free Strategy and its respective screeners that I use:
Also, last screener is my favorite to pick early momentum stocks.
These few screeners I am personally using to trim down the stock list and it can benefit others as well.
If you found this useful, please RT the first tweet.
For live trading and stock market related updates, you can join our Telegram Channel
Most of us use screeners to filter buzzing stocks out of 1000+ stock and it saves lot of times.
Here is the list of top screeners:
Also, last screener is one of my favourite to pick early momentum stocks.
1/ Volume Buzzer:
This can be used on daily time frame and it identifies all the stocks where volume action was very
2/ Bullish Divergence:
This screener will help you find all the stocks that has given bullish divergence. Traders who like to trade reversal stocks that are in downtrend can use this screener. This can be used at the end of the
3/ Bearish Divergence:
This screener will help you find all the stocks that has given bearish divergence. Traders who like to trade reversal stocks that are in uptrend can use this screener. This can be used at the end of the
4/ Nimblr F2F:
This screener was designed from @Deishma F2F video:
https://t.co/apaQYVbAlq
This screener helps in identifying momentum and indecisive candles on daily time


Here is a master thread of how most of the indicators can be used in trading/investing to increase accuracy for free🧵:
Also, the last indicator and strategy is my favourite of all in trading.
1/ Moving Average is a very common indicator.
This thread is on what are the different ways of using the moving average
Moving Averages is a common indicator which most of us (novice/professional) use in the stock market for trading and investment.
— Yash Mehta (@YMehta_) October 11, 2021
This learning thread would be on
"\U0001d650\U0001d668\U0001d65a\U0001d668 \U0001d664\U0001d65b \U0001d648\U0001d664\U0001d66b\U0001d65e\U0001d663\U0001d65c \U0001d63c\U0001d66b\U0001d65a\U0001d667\U0001d656\U0001d65c\U0001d65a"
Like\U0001f44d & Retweet\U0001f504 for wider reach and more such learning thread.
1/10
2/ RSI is one of the momentum indicator for traders.
In this thread, I have shared different ways of using RSI. Also, an investing strategy is shared, which can help you to pick stocks that can give you good
#RSI is a common indicator which most of us use in the stock market.
— Yash Mehta (@YMehta_) October 22, 2021
This learning thread would be on
"\U0001d650\U0001d668\U0001d65a\U0001d668 \U0001d664\U0001d65b \U0001d64d\U0001d64e\U0001d644"
Like\U0001f44d & Retweet\U0001f504 for wider reach and for more such learning thread in the future.
Also, an investment strategy is shared using RSI in the end.
1/16
3/ CCI is another amazing indicator that is used by momentum traders.
Shared few strategies with CCI which a trader and investor both can
#CCI is an indicator which is used in the #stockmarket
— Yash Mehta (@YMehta_) February 26, 2022
This learning thread would be on
"\U0001d650\U0001d668\U0001d65a\U0001d668 \U0001d664\U0001d65b \U0001d63e\U0001d63e\U0001d644"
Also, an investment strategy and trading strategy is shared
If you appreciate this, a Like & Retweet will go a long way in maximizing the reach of this tweet\u2665\ufe0f
1/19
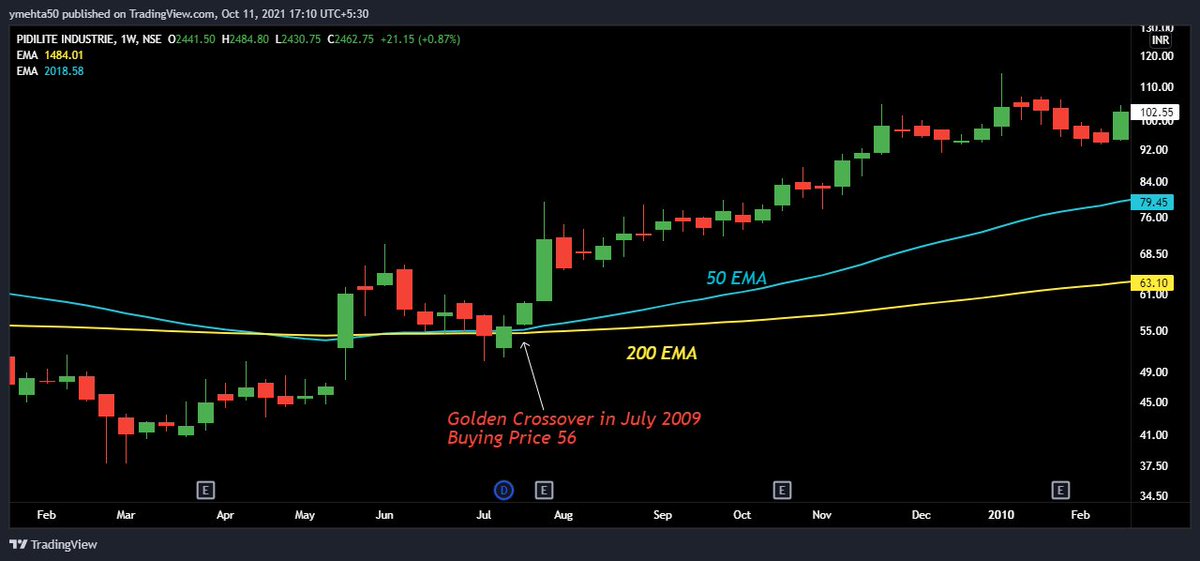
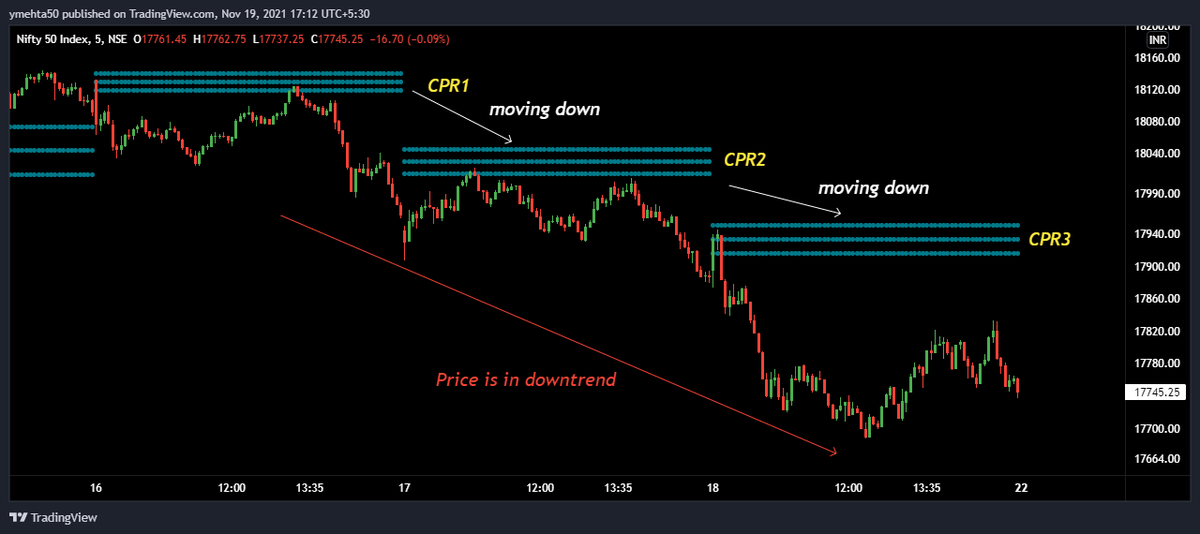
4/ CPR is one of the most popular indicator in the trading community.
This thread covers everything about the CPR indicator and how to use this indicator in
#CPR is an indicator which is used for #Intraday in Stock Market.
— Yash Mehta (@YMehta_) November 19, 2021
This learning thread would be on
"\U0001d650\U0001d668\U0001d65a\U0001d668 \U0001d664\U0001d65b \U0001d63e\U0001d64b\U0001d64d"
Like\u2764\ufe0f& Retweet\U0001f501for wider reach and for more such learning thread in the future.
Also, an investment strategy is shared using CPR in the end.
1/24
In this thread 🧵, shared three steps that can help you in Option Trading even with small capital.
A complete course worth ₹ 50K for free.
1/ Creating a view based on some analysis:
It can be Technical/Chart, Option Chain or some Data analysis.
We have written a thread last week on what all the basic strategies you can use based on your view.
Checkout the thread
Option trading is tough as there are many strategies based on different market view.
— Yash Mehta (@YMehta_) September 30, 2022
Sharing 6 basic Option Strategies for free that you can use based on different market view (sold as a \u20b9 25,000 course!).
A thread \U0001f9f5:
Now, after forming a view on a stock or index, don't directly jump to take the position.
Analyze the position first.
Some free tools that you can use are:
- Opstra
- @BeSensibull : Integrated with your Broker
We will talk on how to analyze Nifty Option trades from option selling perspective and what all things to look at.
Same thing you can replicate for Stock or Banknifty Options as well.
2/ Analyzing the position:
Let's say I am having bullish view on Nifty, then I can simply short Put Options and Hedge it as well so that margin requirement will reduce.
Let's assume Nifty is at 17000.
So I am looking to short 17000 PE and Buying 17800 PE.
Here is a master thread related that will help a beginner to understand about Options Trading.
A complete course worth Rs 50K for free.
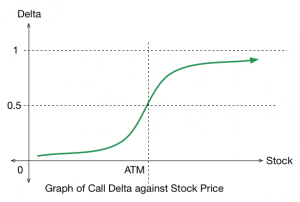
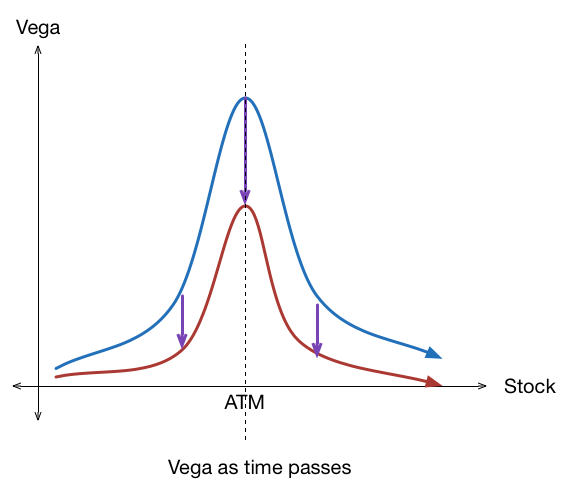
1/ A detailed thread on basics of Option Greeks and how it impacts Options
There are various Options Greeks like: Delta, Gamma, Vega, Rho, Theta.
— Yash Mehta (@YMehta_) September 4, 2022
A complete guide on how these #Option Greeks impact option price.
2/ Basic Option Trading Strategies:
There are many option strategies to trade. But keeping your strategy simple is the key.
In this thread, all the basic option trading strategies are being
Option trading is tough but here\u2019s what can make it easier for you
— The Chartians (@chartians) September 17, 2022
8 option strategies that you can use in any market (sold as a \u20b9 50,000 course !)
3/ What are the things that you should look at before taking any Option
They say options trading can make YOU BANKRUPT - is it true ?
— The Chartians (@chartians) September 23, 2022
If yes then why ?
A thread on Risk management and Position sizing in options trading (worth 50k\u20b9 course)\U0001f9f5
4/ Is Option Selling Possible with Rs 1 Lakh Capital?
Even a beginner can start trading in option selling with capital as low as Rs 1 Lakh.
What are the techniques one can use and how to mitigate the infinite loss risk is shared in this
101 guide on how you can start option selling to generate active returns with less capital (Rs 1 Lakh) \U0001f9f5:
— Yash Mehta (@YMehta_) August 19, 2022
A course on option selling available for free.


Sharing SIMPLE Index Option Selling Strategies that I personally use and less effort is required.
A course worth Rs 50K for FREE.
Last strategy is my favourite.
1/ Short Straddle/Iron Condor for Expiry (Famous 916 Strategy):
Just create a Short Straddle/Iron Condor 100 points away in Nifty on expiry day.
For eg. if Nifty Spot is at 17610, then short 17700 CE and 17500 PE.
Iron Condor can be taken by buying 300 points away hedge.
Exit Strategy:
1. Exit all the Position if any of the options become ATM or near to that. For this, an alert at upper and lower levels can be placed.
2. If the above condition is not executed, then close the position manually by 3:15 PM.
For example: In Last Expiry, we have taken below Short Straddle Trade and same was shared live.
Stoploss was kept as 17450/17750 after considering the premium that we collected from
Taking this Intraday trade for today's expiry
— Yash Mehta (@YMehta_) February 2, 2023
Selling Nifty 17700 CE and Nifty 17500 PE
One can hedge it by buying OTM options to reduce margin or can go naked selling.
Stoploss: 17450/17750
Combined Premium of selling is 43 points pic.twitter.com/ga3hIoVTPC
For Banknifty, short straddle can be created for 250/300 points away and for Finnifty 100 points away.
Trading these two indices is bit difficult as they are very volatile and can give wild swings during intraday and especially on expiry days.