Over 99% of the option traders lose money in option trading because of not following proper Risk Management and Position Sizing.

In this thread ๐Ÿงต, shared three steps that can help you in Option Trading even with small capital.

A complete course worth โ‚น 50K for free.

1/ Creating a view based on some analysis:

It can be Technical/Chart, Option Chain or some Data analysis.

We have written a thread last week on what all the basic strategies you can use based on your view.

Checkout the thread hereโคต๏ธ
https://t.co/rVd2SkBiYR
Now, after forming a view on a stock or index, don't directly jump to take the position.

Analyze the position first.

Some free tools that you can use are:
- Opstra
- @BeSensibull : Integrated with your Broker
We will talk on how to analyze Nifty Option trades from option selling perspective and what all things to look at.

Same thing you can replicate for Stock or Banknifty Options as well.
2/ Analyzing the position:

Let's say I am having bullish view on Nifty, then I can simply short Put Options and Hedge it as well so that margin requirement will reduce.

Let's assume Nifty is at 17000.

So I am looking to short 17000 PE and Buying 17800 PE.
Now, use Opstra Strategy Builder to analyse the position.

Link: 
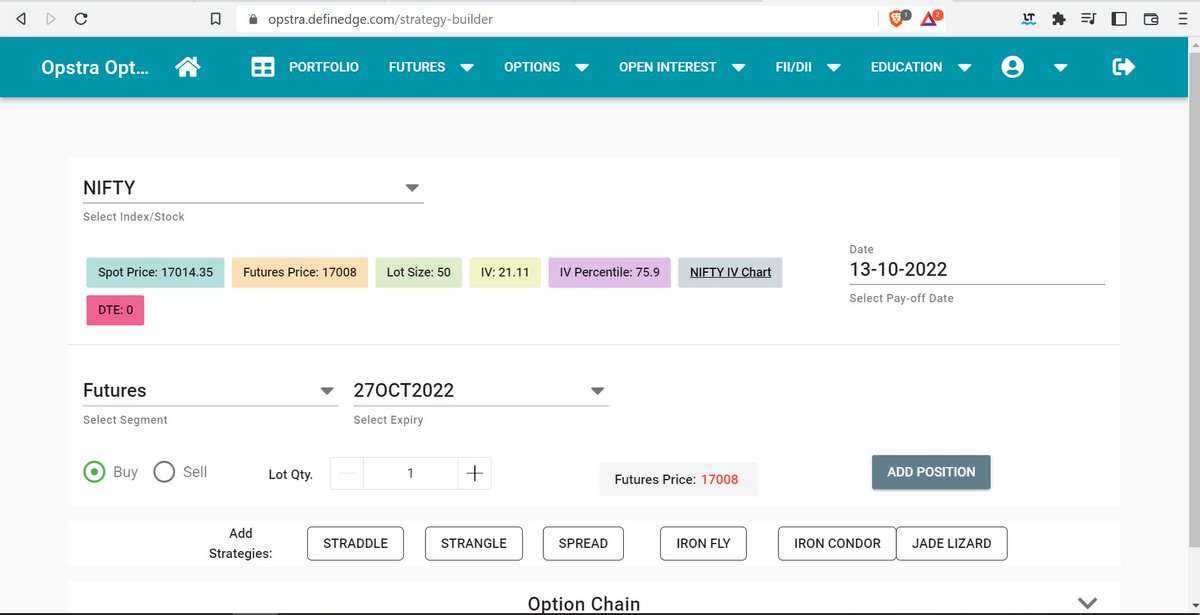
https://t.co/BhduWZOf3F

Something like this will open on your browser.

So here you can select various expiry, Stock or Nifty/BankNifty Futures/Options.
So, I will simply add my position here in the Opstra which was 17000 PE sell and 17800 Buy as hedge.

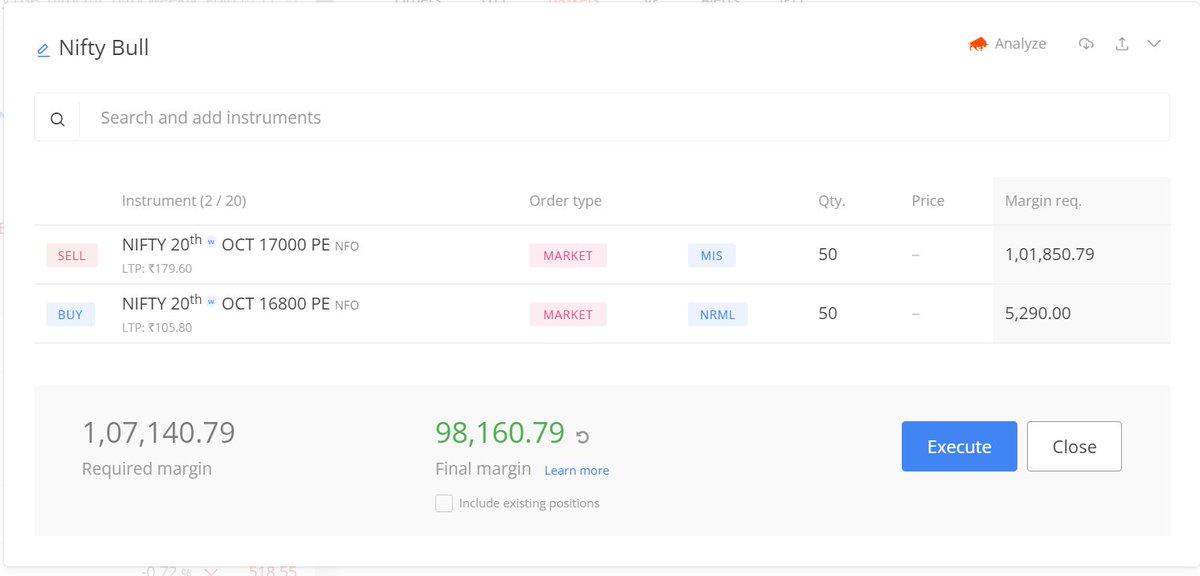
After adding position, it gives some additional information about the position.

In this, most important is Max Loss. For current position, max loss is Rs 6,300 with one lot.
Other things are Probability of Profit, Max Profit, R:R ratio (this will not be favorable for option seller), Breakeven points and Margin Requirement.

Other than these, there is a graph which shows how payoff will look like on expiry(shaded part) and today (blue dotted line.)
If you are an option seller, then it's advisable to keep Stoploss at Breakeven levels or if the main option position becomes ATM.
Option buyers will get similar data if we check.

Let's assume the same view, Nifty is bullish.

So I will buy 17000 CE and Sell 17200 CE, or even I buy naked 17000 CE then let's see the data.
3/ Risk and Money Management:

This is the most important thing which option traders miss on.

You know how much is your max loss in any position based on the analysis.

So for any position, don't take more than 5% risk on your capital in any position.
There is a huge difference in Capital and Margin.

If you see 17000PE sell and 16800 PE buy position then max loss is Rs 6,300 and Margin Requirement is Rs 27,000.

So my risk on margin would be 23% and this is incorrect.
So what is the correct way?

If your max loss is Rs 6,300 and considering this to be 5% risk on the capital, then your minimum capital should be around Rs 1.3 Lakh for this single position.

If you don't have high capital, then adjust your hedge leg so that risk minimize.
If you have Rs 1 Lakh capital to start with option trading then take Rs 3,000 risk on a single position, that's it.

With this, you will manage your risk, and you won't blow up your account.
One more hack here is if you have a certain capital, then you can take multiple option trades provided all the trades are based on different view.
So, if I think Nifty will go up hence took 17600 PE short.

But if I think the market will be sideways (17300-17900) range, then I can take an Iron Condor as well using same capital.

But this will work only if the view is different.
Now this same three steps can be replicated for BankNifty, Nifty, FinNifty, or any stocks Futures and Options.

Also, the same thing can be replicated on Sensibull. Zerodha user can follow these steps.

Create Basket Order and then click on analyze. Same data you will get.
Just to summarize this thread:
- Create a view (bullish/bearish/sideways).
- Plan your positions.
- Analyze it on the Opstra by adding all the trades.
- Check Max Loss.
- Limit it to max 5% of the total capital.
That's all about how you can plan your Option Trades before and protect yourself from big loss.

If you found this useful, please RT the first tweet.

Also, for live trading and stock market related updates, you can join our Telegram Channel โคต๏ธ

https://t.co/RblJ0xdNEv

More from Yash Mehta

#RS is an indicator which helps in finding strong stock or index in the market.

This learning thread would be on
"๐™๐™จ๐™š๐™จ ๐™ค๐™› ๐™๐™š๐™ก๐™–๐™ฉ๐™ž๐™ซ๐™š ๐™Ž๐™ฉ๐™ง๐™š๐™ฃ๐™œ๐™ฉ๐™"

Shared some strategy.

Like๐Ÿ‘ & Retweet๐Ÿ”„for wider reach and for more such learning thread in the future.

1/22

Most of us would confuse it with Relative Strength Index (RSI) but Relative Strength is a different indicator.

We have already covered about "Uses of RSI" in below thread๐Ÿ‘‡
https://t.co/oTOrW7joNI

One can go through this if you haven't.

2/22


Now coming to Relative Strength (RS).

It is basically a strategy used in momentum investing which shows strength or weakness between two asset classes (two stocks, index, commodity).

One can read about this in below

As of now, I am using this indicator on .@tradingview platform.

It's free and one can add it in their Tradingview account as well, using this link๐Ÿ‘‡
https://t.co/FxCjJFsNOG

There are multiple variants in this as well. Some traders use multiple time frame RS.

4/22

RS basically compares returns of one stock/index with the returns of benchmark stock/index at a particular time horizon.

Let's say, I want to analyze TCS and Benchmark Index is Nifty.

5/22
In the early stage, most of the traders & investors use indicators in their analysis.

Here is a master thread of how most of the indicators can be used in trading/investing to increase accuracy for free๐Ÿงต:

Also, the last indicator and strategy is my favourite of all in trading.

1/ Moving Average is a very common indicator.

This thread is on what are the different ways of using the moving average


2/ RSI is one of the momentum indicator for traders.

In this thread, I have shared different ways of using RSI. Also, an investing strategy is shared, which can help you to pick stocks that can give you good


3/ CCI is another amazing indicator that is used by momentum traders.

Shared few strategies with CCI which a trader and investor both can


4/ CPR is one of the most popular indicator in the trading community.

This thread covers everything about the CPR indicator and how to use this indicator in
Moving Averages is a common indicator which most of us (novice/professional) use in the stock market for trading and investment.

This learning thread would be on
"๐™๐™จ๐™š๐™จ ๐™ค๐™› ๐™ˆ๐™ค๐™ซ๐™ž๐™ฃ๐™œ ๐˜ผ๐™ซ๐™š๐™ง๐™–๐™œ๐™š"

Like๐Ÿ‘ & Retweet๐Ÿ”„ for wider reach and more such learning thread.

1/10

Basics of the moving average:

It takes average of the price for the duration we want.

So 10 days moving average means an average price of 10 days closing price.

Common types of Moving Average:
Simple, Exponential, Weighted.

Use only one type in your trading setup.

2/10


Different uses:

1โƒฃ Moving Average Crossovers:

Common strategy used by positional traders and investor in finding multibagger or good returns stocks.

Common crossover used is for 50 & 200 Moving Average.

Also, this is called as "๐—š๐—ผ๐—น๐—ฑ๐—ฒ๐—ป ๐—–๐—ฟ๐—ผ๐˜€๐˜€๐—ผ๐˜ƒ๐—ฒ๐—ฟ"

3/10

In this buy signal is initiated when lower MA (50 EMA) crosses above higher MA (200 EMA).
And exit or sell signal is intiated when lower MA (50 EMA) crosses below higher MA (200 EMA).

4/10

Let's see an example:
Pidilite Industries

Buying Price was 56 in 2009 and CMP is 2462 and still there is no selling signal.

44 times Multibagger or 4300% returns.

In lower time frame, it will give more whipsaw and more number of trades.

5/10
#RSI is a common indicator which most of us use in the stock market.

This learning thread would be on
"๐™๐™จ๐™š๐™จ ๐™ค๐™› ๐™๐™Ž๐™„"

Like๐Ÿ‘ & Retweet๐Ÿ”„ for wider reach and for more such learning thread in the future.

Also, an investment strategy is shared using RSI in the end.

1/16

Setup 1:

RSI- commonly used to show whether price is overbought or oversold.

General rule:
๐‘๐’๐ˆ > ๐Ÿ•๐ŸŽ -- ๐Ž๐ฏ๐ž๐ซ๐›๐จ๐ฎ๐ ๐ก๐ญ
๐‘๐’๐ˆ < ๐Ÿ‘๐ŸŽ -- ๐Ž๐ฏ๐ž๐ซ๐ฌ๐จ๐ฅ๐

One becomes cautious once price becomes overbought and optimistic when price becomes oversold.

2/16

Let's understand this with an example of Laurus Labs:

1. It was in overbought zone and after a few days when a small dip was seen from 693 to 588 (15% downside)

2. It was in oversold zone and after a few days when a small rally was seen from 59 to 107 (82% upside)

3/16


Well, this looks very easy, but it is not.

When a price is in overbought zone and is in momentum, then it can move up without taking a dip and exiting or shorting stock would prove wrong.

When IRCTC was in overbought zone, price went up from 2718 to 6396 (135% rally).

4/16


Similarly, for oversold stock.

When a price is in oversold zone and is crashing, then it can move down without taking an upmove and buying stock would prove wrong.

When DHFL was in oversold zone, price went down from 126 to 11 (91% crash).

5/16

More from All

You May Also Like

The YouTube algorithm that I helped build in 2011 still recommends the flat earth theory by the *hundreds of millions*. This investigation by @RawStory shows some of the real-life consequences of this badly designed AI.


This spring at SxSW, @SusanWojcicki promised "Wikipedia snippets" on debated videos. But they didn't put them on flat earth videos, and instead @YouTube is promoting merchandising such as "NASA lies - Never Trust a Snake". 2/


A few example of flat earth videos that were promoted by YouTube #today:
https://t.co/TumQiX2tlj 3/

https://t.co/uAORIJ5BYX 4/

https://t.co/yOGZ0pLfHG 5/