Investing in stocks is boring, but it can help in creating wealth for many investors.

Sharing 4 Simple Investment Strategies (sold as a ₹ 50,000 course!).

For guidance, shared screeners for all the strategies also.

Shared a bonus trading strategy at the end.

A thread 🧵:

1/ All Time High Breakout:

Stock that breaks the uptrend are the one that can give massive upmove.
These stocks are considered as strong stocks in the market.

Timeframe should be monthly and if price closes above ATH on any day you can enter.
Example 1:

Bajaj Finance gave a breakout above ATH at around 55 and then it moved up till 5000 levels.

Total returns of 9000% in 10 years.

Simple Strategy, isn't it?
Example 2:

Reliance Chart.

It gave breakout above its All Time High level after 10 years and then never looking back.

Price moved up from 700 to 2600.
Returns of 270% in five years.
How to Follow Stoploss?

Initially keep stoploss at swing low on monthly chart and trail your stoploss accordingly to enjoy massive upmove.

Other ways of Trailing Stoploss can be using 200 EMA or any other indicator.
All Time High Breakout Screener:

This screener will identify stocks that are breaking All time high (10 year high). It needs to be run daily to identify such stocks.

https://t.co/zEUg5SAkgs
2/ Golden Crossover (Two EMA):

It is one of the popular investment strategy widely used by traders/investors.

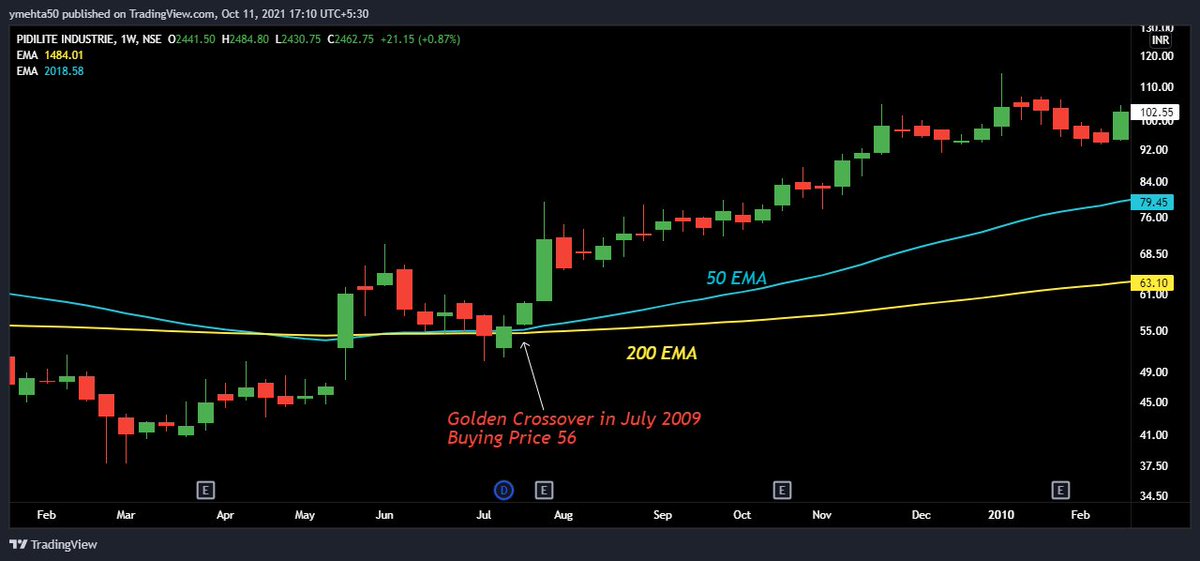
Common Golden Crossover that is followed is of 20 EMA and 200 EMA.

Enter if 20 EMA goes above 200 EMA.
Exit if 20 EMA goes below 200 EMA.

Time frame: Weekly/Monthly
Let's see some example.

Example 1:

Pidilite Ind gave golden crossover in 2009 at 71 and till now it has not given any exit.

From 71, currently it is trading at 2662.

Returns of 3600% in 13 years.
Example 2:

ITC gave golden crossover in 2003 at around 17 and after that it directly gave exit signal in 2019 at 238.

It gave returns of 1300% in 16 years.

Golden Crossover Strategy is completely rule based system and can be easily implemented.
Screener Link for Golden Crossover:

This is a basic screener that will identify stocks that give golden crossover. You can tweak it if you want or add any other condition.

https://t.co/zZ2iuPO2QW
3/ CCI:

CCI is known as momentum indicator and can be a good for investor with shorter horizon of 2-3 years.

Strategy:
⚡️Weekly/Monthly TF
⚡️Enter: CCI crosses above -100
⚡️Stoploss: CCI crosses below -100
⚡️Exit if CCI crosses above +100 and then it goes below that
Let's see example for this:

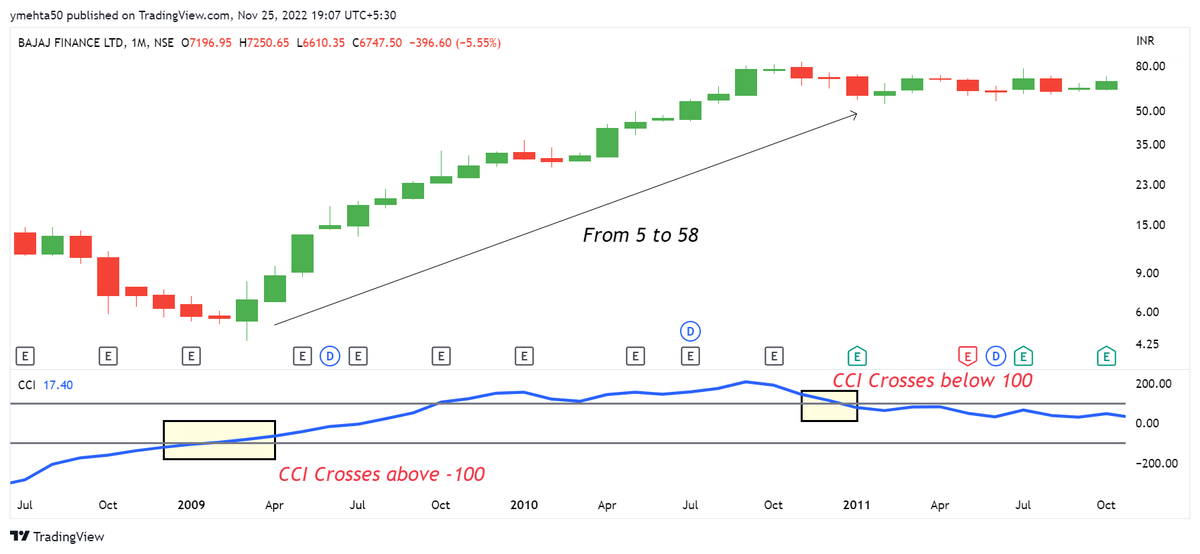
Bajaj Finance Monthly Charts.

CCI crossed above -100 in 2009 and price was around 5.
It gave an exit at around 58 when CCI crossed below +100.

Returns in 1 year: 1000%
Screener Link of CCI:

This screener will identify stocks that are fulfilling entry criteria for CCI.

https://t.co/aGYyXh1tkp
Here if you see entry and exit was within 1 year which is very short.

CCI identifies stocks that are in momentum and can give decent returns in less duration.
4/ RSI:

Just like CCI, RSI is also a momentum indicator.

Strategy:
⚡️Monthly TF
⚡️Enter: RSI crosses above +50
⚡️Stoploss or TSL: RSI crosses below +50

It is also rule based strategy.
Let's see an example.

Laurus Lab Monthly Chart.

RSI crossed above 50 and entry was triggered at 90.
After that, RSI never went below 50.

So far, stock is up from 90 to 450.
Almost 400% returns in 2 years.
Screener for RSI:

This screener needs to be run on month end and it will give out stocks that are fulfilling entry criteria of RSI Investment strategy.

https://t.co/jpr2ptWOSn
Out of all the four strategies that are shared, the first one based on All-Time High Breakout is completely discretionary and rest are rule based.

Also, note stoploss will be big in case of investment strategies so your quantities will be based on proper position sizing.
That's all about a simple Investment Strategy that you can use to compound your capital.

If you found this useful, please RT the first tweet.

Also, for live trading and stock market related updates, you can join our Telegram Channel ⤵️

https://t.co/RblJ0wWKCv

More from Yash Mehta

Over 99% of the option traders lose money in option trading because of not following proper Risk Management and Position Sizing.

In this thread 🧵, shared three steps that can help you in Option Trading even with small capital.

A complete course worth ₹ 50K for free.

1/ Creating a view based on some analysis:

It can be Technical/Chart, Option Chain or some Data analysis.

We have written a thread last week on what all the basic strategies you can use based on your view.

Checkout the thread


Now, after forming a view on a stock or index, don't directly jump to take the position.

Analyze the position first.

Some free tools that you can use are:
- Opstra
- @BeSensibull : Integrated with your Broker

We will talk on how to analyze Nifty Option trades from option selling perspective and what all things to look at.

Same thing you can replicate for Stock or Banknifty Options as well.

2/ Analyzing the position:

Let's say I am having bullish view on Nifty, then I can simply short Put Options and Hedge it as well so that margin requirement will reduce.

Let's assume Nifty is at 17000.

So I am looking to short 17000 PE and Buying 17800 PE.
#RS is an indicator which helps in finding strong stock or index in the market.

This learning thread would be on
"𝙐𝙨𝙚𝙨 𝙤𝙛 𝙍𝙚𝙡𝙖𝙩𝙞𝙫𝙚 𝙎𝙩𝙧𝙚𝙣𝙜𝙩𝙝"

Shared some strategy.

Like👍 & Retweet🔄for wider reach and for more such learning thread in the future.

1/22

Most of us would confuse it with Relative Strength Index (RSI) but Relative Strength is a different indicator.

We have already covered about "Uses of RSI" in below thread👇
https://t.co/oTOrW7joNI

One can go through this if you haven't.

2/22


Now coming to Relative Strength (RS).

It is basically a strategy used in momentum investing which shows strength or weakness between two asset classes (two stocks, index, commodity).

One can read about this in below

As of now, I am using this indicator on .@tradingview platform.

It's free and one can add it in their Tradingview account as well, using this link👇
https://t.co/FxCjJFsNOG

There are multiple variants in this as well. Some traders use multiple time frame RS.

4/22

RS basically compares returns of one stock/index with the returns of benchmark stock/index at a particular time horizon.

Let's say, I want to analyze TCS and Benchmark Index is Nifty.

5/22

More from Finance

You May Also Like

1/ Here’s a list of conversational frameworks I’ve picked up that have been helpful.

Please add your own.

2/ The Magic Question: "What would need to be true for you


3/ On evaluating where someone’s head is at regarding a topic they are being wishy-washy about or delaying.

“Gun to the head—what would you decide now?”

“Fast forward 6 months after your sabbatical--how would you decide: what criteria is most important to you?”

4/ Other Q’s re: decisions:

“Putting aside a list of pros/cons, what’s the *one* reason you’re doing this?” “Why is that the most important reason?”

“What’s end-game here?”

“What does success look like in a world where you pick that path?”

5/ When listening, after empathizing, and wanting to help them make their own decisions without imposing your world view:

“What would the best version of yourself do”?
@EricTopol @NBA @StephenKissler @yhgrad B.1.1.7 reveals clearly that SARS-CoV-2 is reverting to its original pre-outbreak condition, i.e. adapted to transgenic hACE2 mice (either Baric's BALB/c ones or others used at WIV labs during chimeric bat coronavirus experiments aimed at developing a pan betacoronavirus vaccine)

@NBA @StephenKissler @yhgrad 1. From Day 1, SARS-COV-2 was very well adapted to humans .....and transgenic hACE2 Mice


@NBA @StephenKissler @yhgrad 2. High Probability of serial passaging in Transgenic Mice expressing hACE2 in genesis of SARS-COV-2


@NBA @StephenKissler @yhgrad B.1.1.7 has an unusually large number of genetic changes, ... found to date in mouse-adapted SARS-CoV2 and is also seen in ferret infections.
https://t.co/9Z4oJmkcKj


@NBA @StephenKissler @yhgrad We adapted a clinical isolate of SARS-CoV-2 by serial passaging in the ... Thus, this mouse-adapted strain and associated challenge model should be ... (B) SARS-CoV-2 genomic RNA loads in mouse lung homogenates at P0 to P6.
https://t.co/I90OOCJg7o