https://t.co/K0Osq3fAal
There are various Options Greeks like: Delta, Gamma, Vega, Rho, Theta.
— Yash Mehta (@YMehta_) September 4, 2022
A complete guide on how these #Option Greeks impact option price.
There are various Options Greeks like: Delta, Gamma, Vega, Rho, Theta.
— Yash Mehta (@YMehta_) September 4, 2022
A complete guide on how these #Option Greeks impact option price.
Option trading is tough but here\u2019s what can make it easier for you
— The Chartians (@chartians) September 17, 2022
8 option strategies that you can use in any market (sold as a \u20b9 50,000 course !)
They say options trading can make YOU BANKRUPT - is it true ?
— The Chartians (@chartians) September 23, 2022
If yes then why ?
A thread on Risk management and Position sizing in options trading (worth 50k\u20b9 course)\U0001f9f5
101 guide on how you can start option selling to generate active returns with less capital (Rs 1 Lakh) \U0001f9f5:
— Yash Mehta (@YMehta_) August 19, 2022
A course on option selling available for free.
We have been taking weekly #Nifty #Options trade every week.
— Yash Mehta (@YMehta_) November 17, 2021
In this learning thread would be about:#Positional \U0001d64a\U0001d665\U0001d669\U0001d65e\U0001d664\U0001d663 \U0001d652\U0001d667\U0001d65e\U0001d669\U0001d65e\U0001d663\U0001d65c #\U0001d64e\U0001d669\U0001d667\U0001d656\U0001d669\U0001d65a\U0001d65c\U0001d66e"
Like\u2764\ufe0f & Retweet\U0001f501for wider reach and for more learning thread in the future.
1/12 pic.twitter.com/x9WDDwD1zg
Option Trading is very difficult to master as there are so many things to understand.
— Yash Mehta (@YMehta_) September 25, 2022
Here is a master thread related that will help a beginner to understand about Options Trading.
A complete course worth Rs 50K for free.
#RSI is a common indicator which most of us use in the stock market.
— Yash Mehta (@YMehta_) October 22, 2021
This learning thread would be on
"\U0001d650\U0001d668\U0001d65a\U0001d668 \U0001d664\U0001d65b \U0001d64d\U0001d64e\U0001d644"
Like\U0001f44d & Retweet\U0001f504 for wider reach and for more such learning thread in the future.
Also, an investment strategy is shared using RSI in the end.
1/16
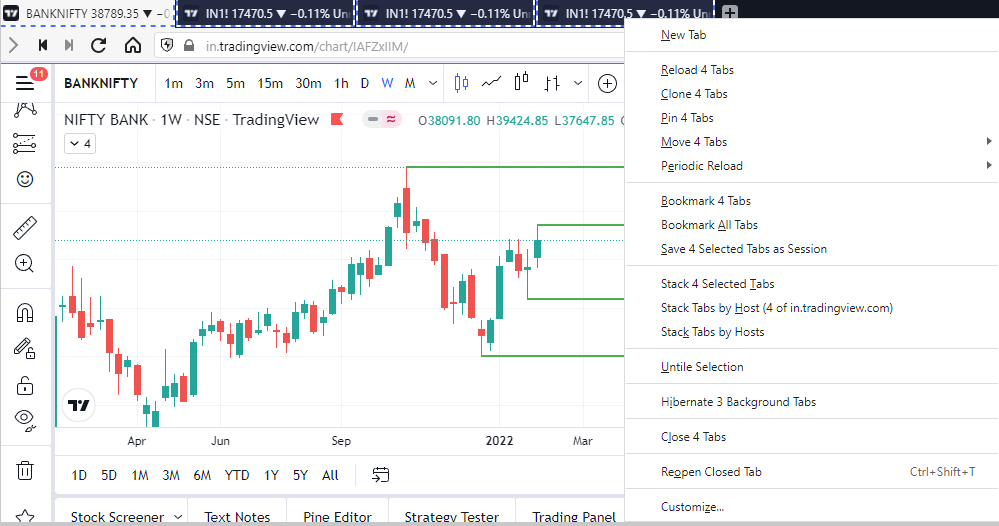
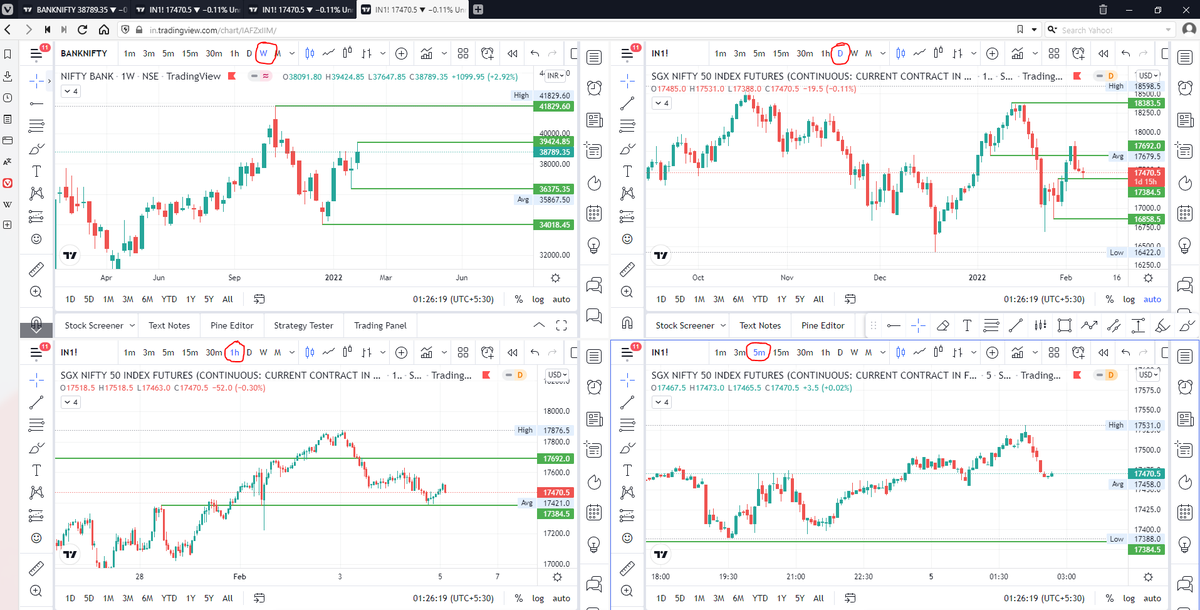
\U0001d5e0\U0001d602\U0001d5f9\U0001d601\U0001d5f6\U0001d5fd\U0001d5f9\U0001d5f2 \U0001d600\U0001d5f2\U0001d5f0\U0001d601\U0001d5fc\U0001d5ff \U0001d604\U0001d5ee\U0001d601\U0001d5f0\U0001d5f5\U0001d5f9\U0001d5f6\U0001d600\U0001d601 \U0001d5fc\U0001d5fb \U0001d5e7\U0001d5ff\U0001d5ee\U0001d5f1\U0001d5f6\U0001d5fb\U0001d5f4\U0001d603\U0001d5f6\U0001d5f2\U0001d604 \U0001d602\U0001d600\U0001d5f6\U0001d5fb\U0001d5f4 \U0001d601\U0001d5f5\U0001d5f2 \U0001d5d9\U0001d5e5\U0001d5d8\U0001d5d8 \U0001d603\U0001d5f2\U0001d5ff\U0001d600\U0001d5f6\U0001d5fc\U0001d5fb!
— Sarosij Ghosh (@sarosijghosh) September 18, 2021
A THREAD \U0001f9f5
Please Like and Re-Tweet. It took a lot of effort to put this together. #StockMarket #TradingView #trading #watchlist #Nifty500 #stockstowatch