Buying/Selling climax is very common in the #stockmarket and it is completely based on the price.

#Volume #Climax is something that I have observed.

In this thread🧵, I am sharing a #trading strategy that I am using based on this.

Like❤️and Retweet🔄 for wider reach.

What is this Volume Climax?

You would have seen some kind of spurt in volume in a day after a up/downtrend. Here, we don't consider any day in which there is corporate action or quarterly result.

Let's see some chart:

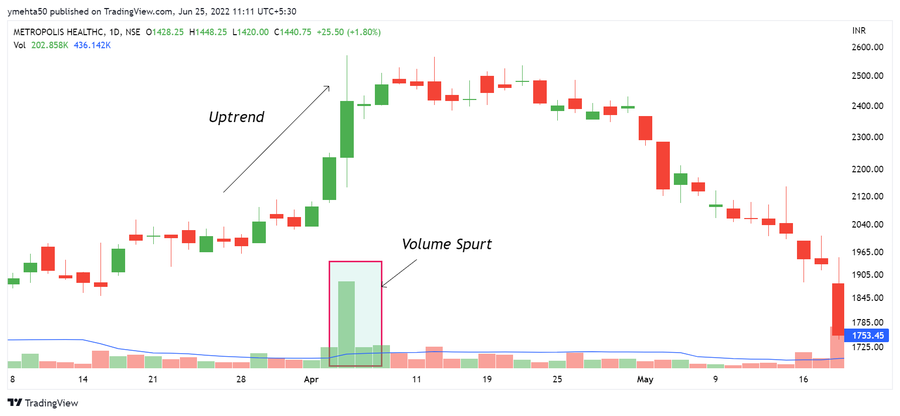
Below Chart is of #Metropolis when volume spurt occurred.
Now one to observe in Metropolis chart is after that volume spurt candle, the uptrend had paused.
This means at this candle smart money had offloaded the stock and retailers bought it. Hence stock went in the downtrend and Metropolis went down by 20%.
So this volume spurt on non corporate action day can bring pause in the existing trend and it can start the opposite trend.

In the above example, when price was in uptrend, it went in downtrend and vice versa is also applicable.
In below example, #IOLCP was in downtrend when volume got spiked. After that, the price moved up by 20% in a few days.

Seems easy right?

But there are some rules that I have created for my own trading. Let's see that now.
So one will ask how much volume spike should be there?

There is no mathematical definition for this. If you open the chart, just see that the volume is highest in the normal range of candle (can consider last 100 candles).
Now where to look at Volume Spike?

Volume Spike should happen after a downtrend/uptrend to catch the reversal trade opposite direction.

Which Time Frame?

Use Daily/Weekly/Monthly but don't use it in #Intraday.
What's the rule for trading?

⚡️After spotting the candle in which Volume Spike is there, mark high and low of that candle as it is very important.
⚡️As we are discussing strategy for buy, we will wait for the price in the next few days to close above the high of that candle
⚡️Once the price closes above the high, buy that stock and keep stoploss a few points below the low of the candle in which the spike is there.
⚡️Sometimes candle will be big and sometimes it will be small, so better risk 2-3% of the total capital in each trade.
⚡️Keep Risk:Reward of atleast 1:2. So let's say risk in stoploss is 10 points, then reward/target has to be more than 20 points.
⚡️I also use 10-20% target for short term and 40-50% target in positional trade. You can use this rule as well.
⚡️As we are taking reversal trade, hence no need for trailing stoploss. Exit if your target is hit or trail aggressively.
⚡️If you see Volume Climax setup at support/resistance, then it is the best trade to take in swing/positional. Never miss such a trade.
Now let's see an example in which I personally took the trade based on Volume Climax and also it was shared on Twitter.

#DMART Weekly Time Frame formed Volume Climax Pattern and after breakout stock moved up by 100%.

Risk was hardly 20% in this.
Same thing can be used in Daily/Monthly time frame considering your trading style.

Best part of taking reversal trade is the risk on the basis of Stoploss is minimal.

Moreover, I use it only for buying as I don't prefer shortselling any stock.
You can check how this setup works on the stock and also comment about the returns that you would have made based on this.

Just a reminder that it is not a holy grail strategy, so follow the trading plan properly and exit if stoploss gets hit.
Expecting that this strategy will be copied by YouTubers/Trainers after seeing the performance and they will twist it a bit and sell it.
But it doesn't matter. The foundation of the strategy is important it is shared here for free.
That's all about the strategy.

If you find this strategy useful, then do give us a Thumbs Up 👍 by Liking ❤️and Retweeting 🔄the first tweet.

Thanks for Reading.

https://t.co/MgKNnAKEDH

More from Yash Mehta

We have shared a couple of screeners based on different strategies.
Creating this master thread of all the screeners that are shared on Twitter.

Save this as it can help traders a lot.

1/ Positional Trading Screener:

Shared 8 screeners that are based on different strategies for positional


2/ Price Action Screener:

Shared 9 screeners that a Price Action trader can use in their


3/ Indicator Strategy based Screener:

Shared 7 screeners that is based on Indicator based trading


These few screeners I am personally using to trim down the stock list and it can benefit others as well.

If you found this useful, please RT the first tweet.

For live trading and stock market related updates, you can join our Telegram Channel
Over 99% of the option traders lose money in option trading because of not following proper Risk Management and Position Sizing.

In this thread 🧵, shared three steps that can help you in Option Trading even with small capital.

A complete course worth ₹ 50K for free.

1/ Creating a view based on some analysis:

It can be Technical/Chart, Option Chain or some Data analysis.

We have written a thread last week on what all the basic strategies you can use based on your view.

Checkout the thread


Now, after forming a view on a stock or index, don't directly jump to take the position.

Analyze the position first.

Some free tools that you can use are:
- Opstra
- @BeSensibull : Integrated with your Broker

We will talk on how to analyze Nifty Option trades from option selling perspective and what all things to look at.

Same thing you can replicate for Stock or Banknifty Options as well.

2/ Analyzing the position:

Let's say I am having bullish view on Nifty, then I can simply short Put Options and Hedge it as well so that margin requirement will reduce.

Let's assume Nifty is at 17000.

So I am looking to short 17000 PE and Buying 17800 PE.

You May Also Like

A THREAD ON @SarangSood

Decoded his way of analysis/logics for everyone to easily understand.

Have covered:
1. Analysis of volatility, how to foresee/signs.
2. Workbook
3. When to sell options
4. Diff category of days
5. How movement of option prices tell us what will happen

1. Keeps following volatility super closely.

Makes 7-8 different strategies to give him a sense of what's going on.

Whichever gives highest profit he trades in.


2. Theta falls when market moves.
Falls where market is headed towards not on our original position.


3. If you're an options seller then sell only when volatility is dropping, there is a high probability of you making the right trade and getting profit as a result

He believes in a market operator, if market mover sells volatility Sarang Sir joins him.


4. Theta decay vs Fall in vega

Sell when Vega is falling rather than for theta decay. You won't be trapped and higher probability of making profit.
I like this heuristic, and have a few which are similar in intent to it:


Hiring efficiency:

How long does it take, measured from initial expression of interest through offer of employment signed, for a typical candidate cold inbounding to the company?

What is the *theoretical minimum* for *any* candidate?

How long does it take, as a developer newly hired at the company:

* To get a fully credentialed machine issued to you
* To get a fully functional development environment on that machine which could push code to production immediately
* To solo ship one material quanta of work

How long does it take, from first idea floated to "It's on the Internet", to create a piece of marketing collateral.

(For bonus points: break down by ambitiousness / form factor.)

How many people have to say yes to do something which is clearly worth doing which costs $5,000 / $15,000 / $250,000 and has never been done before.