SAnngeri Categories Screeners
7 days
30 days
All time
Recent
Popular


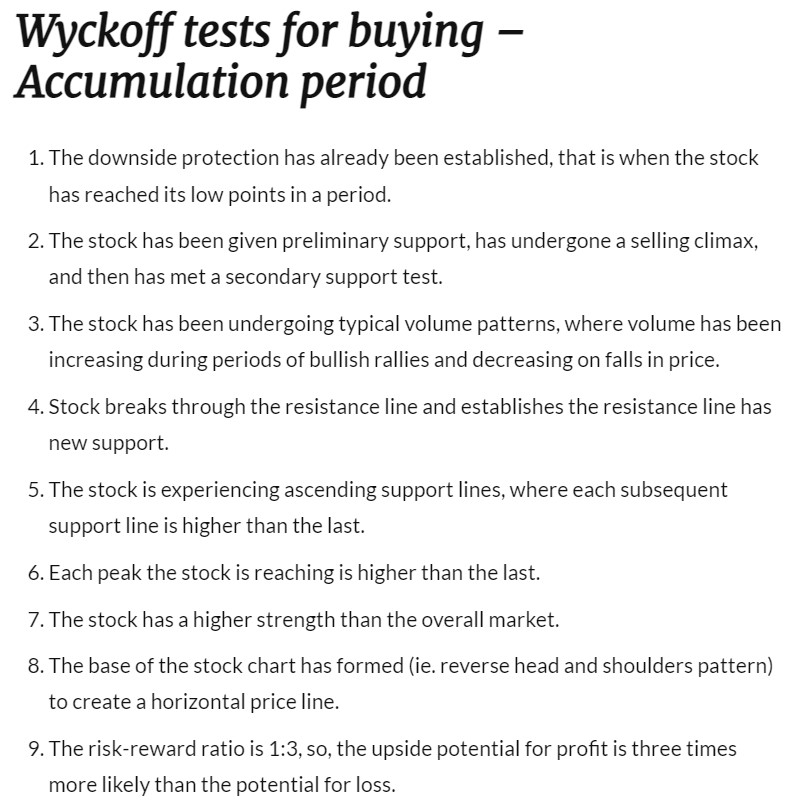
More pointers to help in identifying whether its accumulation or Distribution.
Lest some charlie jumps to point out, let me make it clear that I haven't invented anything in stock market, all my knowledge of stock market comes from old farts. Just my observation is my own. https://t.co/uHNw8tV4AO
Lest some charlie jumps to point out, let me make it clear that I haven't invented anything in stock market, all my knowledge of stock market comes from old farts. Just my observation is my own. https://t.co/uHNw8tV4AO
Plz advice how to identify accumulation and distribution phase...... to me Both looks same
— VIVEK VAID (@bobvaid) February 12, 2022


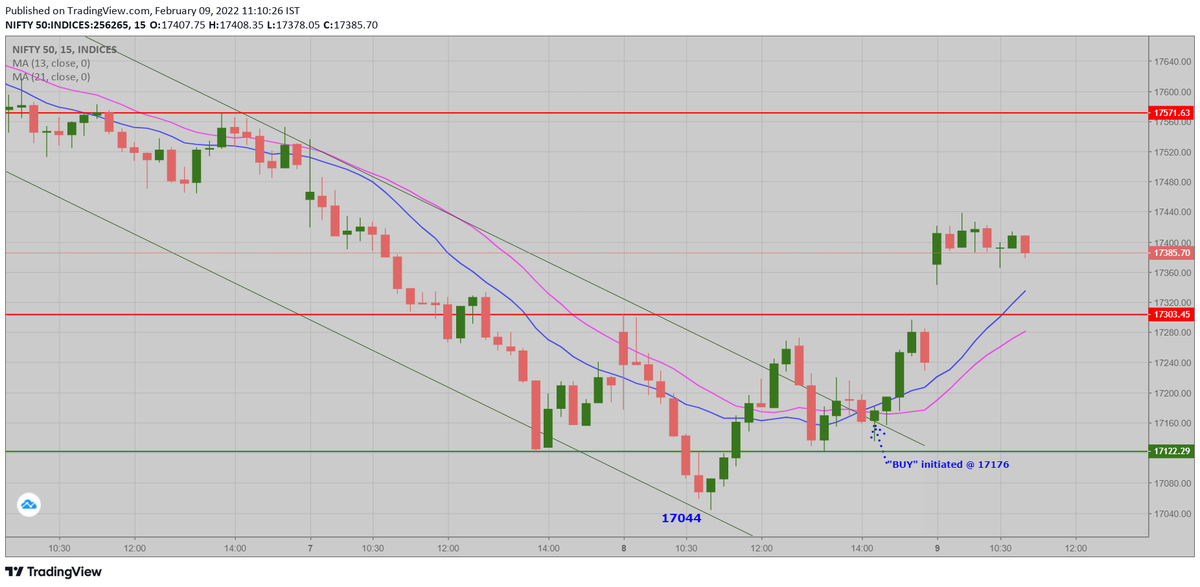
Blue line(13Sma)moves below Red line(26Sma), SELL triggers
Only 2 signals - Buy & Sell
There is no stop loss in this system.
There could be some wild swings in prices like on "Budget Day" - In such a scenario, Keep 30 - 50 points below 21Sma to avoid big DD
It's a SAR system
Only 2 signals - Buy & Sell
There is no stop loss in this system.
There could be some wild swings in prices like on "Budget Day" - In such a scenario, Keep 30 - 50 points below 21Sma to avoid big DD
It's a SAR system
how to take stop loss..? low of prev candle?
— ABHINAV JAIN (@abhijain017) February 9, 2022


Time for a new thread on the possibilities I am looking for.
Do read it completely to understand the stance and the plan.
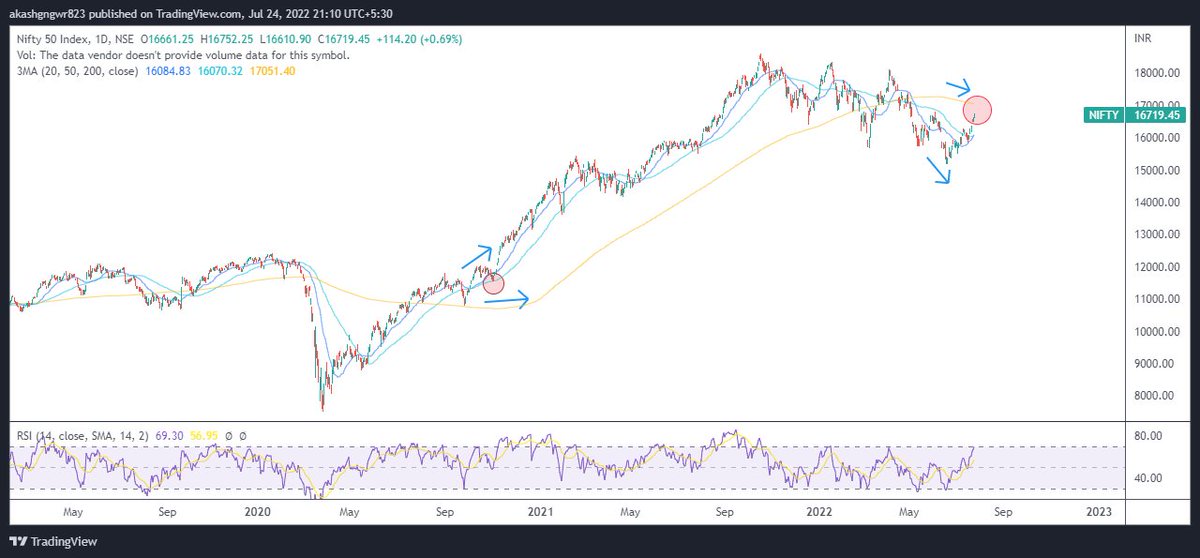
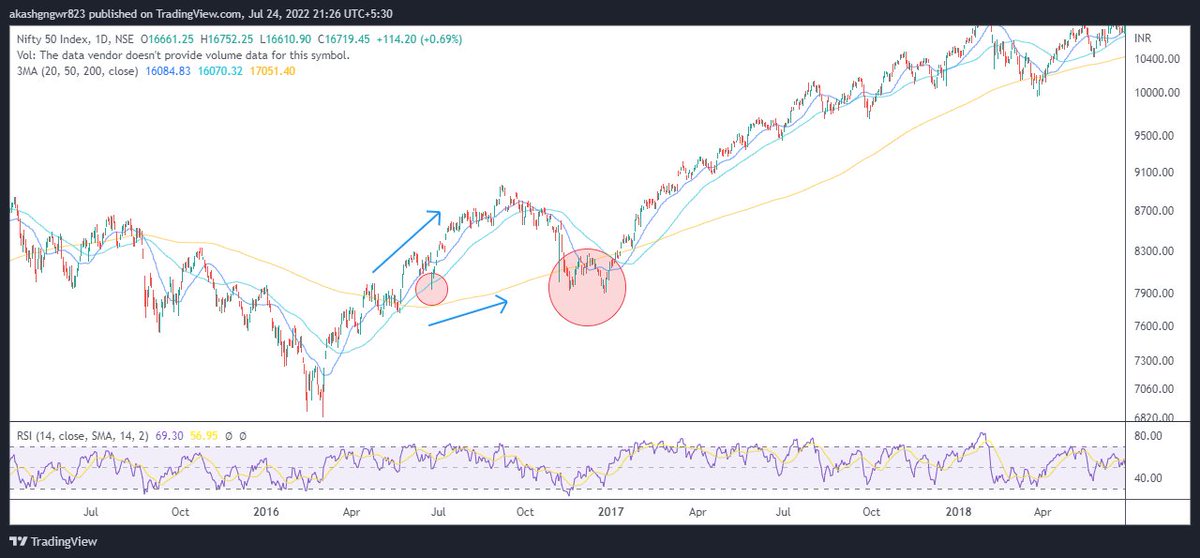
1. The moving average structure - Many traders just look at the 200 ma test or closing above/below it regardless of its slope. Let's look at all the interactions with 200 ma where price met it for the first time after the trend change but with 200 ma slope against it
One can clearly sense that currently it is one of those scenarios only. I understand that I might get trolled for this, but an unbiased mind suggests that odds are highly against the bulls for making fresh investments.
But markets are good at giving surprises. What should be our stance if price kept on rising? Let's understand that through charts. The concept is still the same. Divergent 200 ma and price move results in 200 ma test atleast once which gives good investment opportunities.
2. Zig-Zag bear market- There are two types of fall in a bear market, the first one is vertical fall which usually ends with ending diagonals (falling wedges) and the second one is zig zag one which usually ends with parabolic down moves.
Do read it completely to understand the stance and the plan.
This thread will present a highly probable scenario of markets for the upcoming months. Will update the scenario too if there is a significant change in view in between.
— Aakash Gangwar (@akashgngwr823) May 15, 2022
1/n https://t.co/jfWOyEgZyd
1. The moving average structure - Many traders just look at the 200 ma test or closing above/below it regardless of its slope. Let's look at all the interactions with 200 ma where price met it for the first time after the trend change but with 200 ma slope against it
One can clearly sense that currently it is one of those scenarios only. I understand that I might get trolled for this, but an unbiased mind suggests that odds are highly against the bulls for making fresh investments.
But markets are good at giving surprises. What should be our stance if price kept on rising? Let's understand that through charts. The concept is still the same. Divergent 200 ma and price move results in 200 ma test atleast once which gives good investment opportunities.
2. Zig-Zag bear market- There are two types of fall in a bear market, the first one is vertical fall which usually ends with ending diagonals (falling wedges) and the second one is zig zag one which usually ends with parabolic down moves.

Dear Friends,
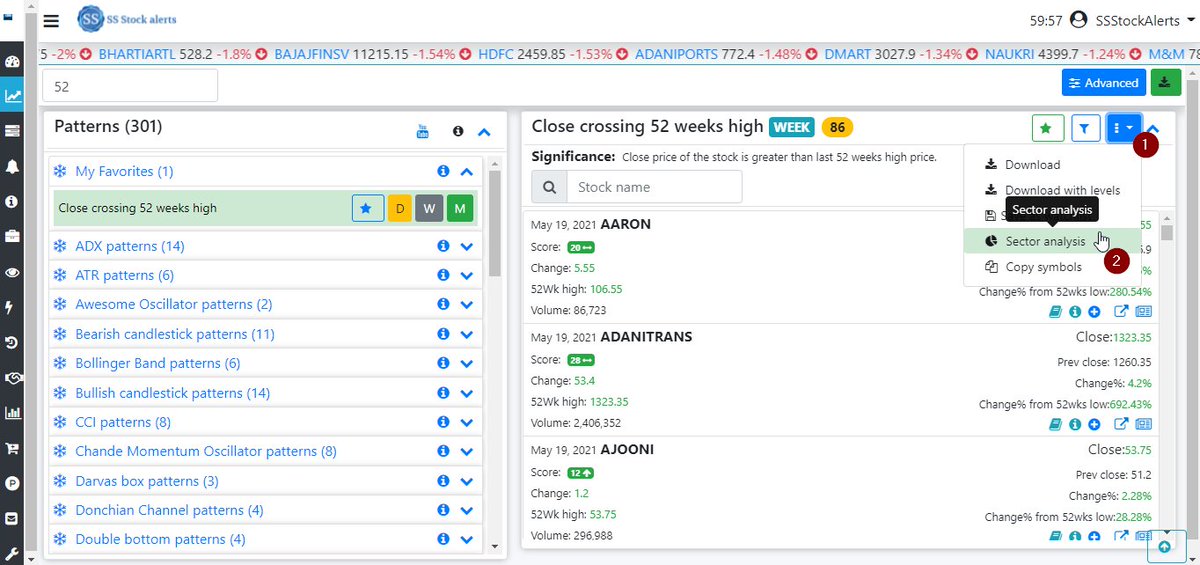
#sssnewfeature
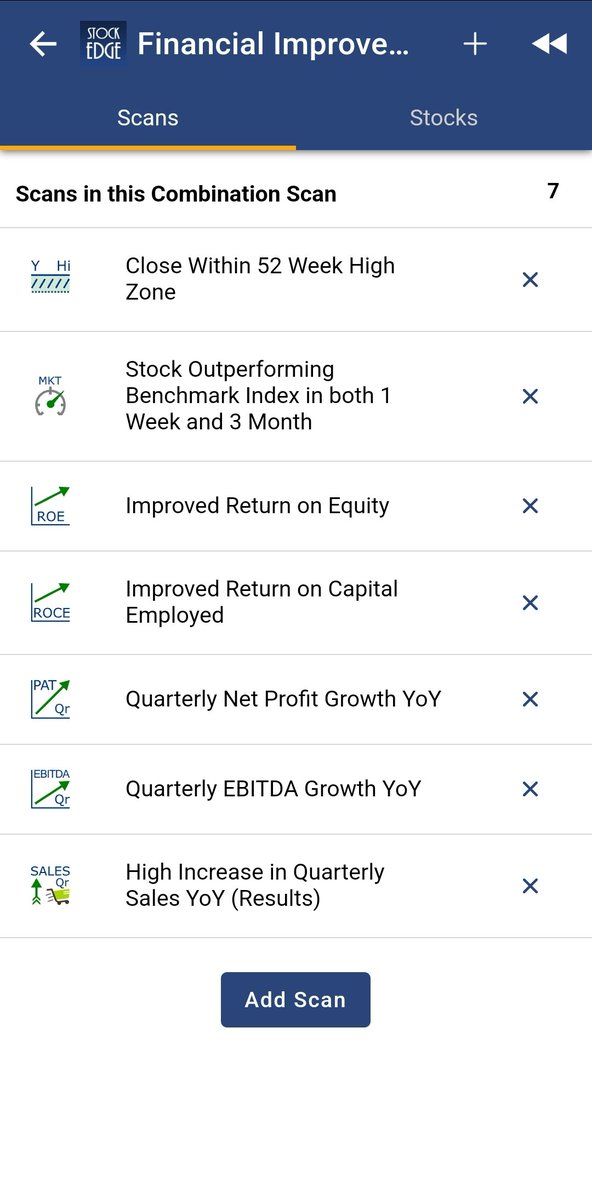
We have implemented sector chart analysis feature and it is available from Scans, Positional and Analysis pages.
Power is given to you. Step ahead with your analysis with leading sectors analysis https://t.co/7rQ5UjCd2J
- 52 weeks high breakout stocks analysis
- You can see them in tabular format as well and get list of stocks for each sector also.
- Enhanced filter to support these sectors, so you can apply these sectors in filter also.
#sssnewfeature
We have implemented sector chart analysis feature and it is available from Scans, Positional and Analysis pages.
Power is given to you. Step ahead with your analysis with leading sectors analysis https://t.co/7rQ5UjCd2J
Dear Friends,
— SSStockAlerts (@ssstockalerts) May 19, 2021
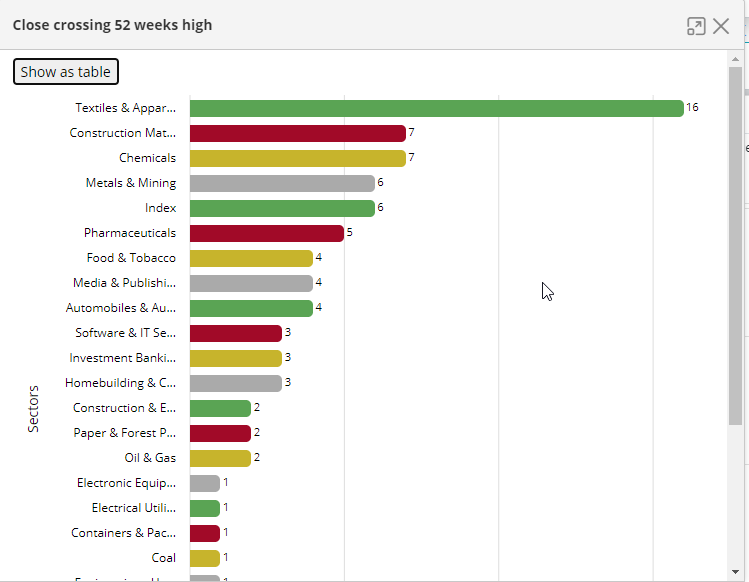
A Sector analysis for scans feature will be added to site.
Eg:- See analysis for 52weeks high breakout, from text tile sector has more breakouts, so concentrate on Textile sector pic.twitter.com/U0cIoEeKDy
- 52 weeks high breakout stocks analysis
- You can see them in tabular format as well and get list of stocks for each sector also.
- Enhanced filter to support these sectors, so you can apply these sectors in filter also.


May please read the attached tweet once again for a key LEARNING
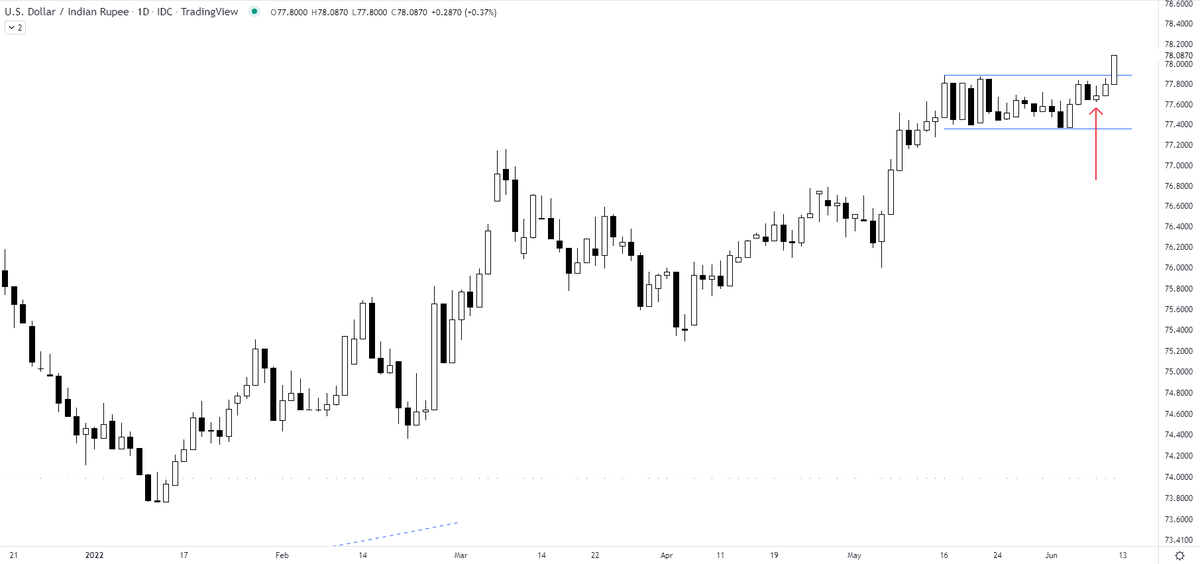
USDINR - a breakout that will not bode well for the equities
78+ https://t.co/AWqZxF5B1L
USDINR - a breakout that will not bode well for the equities
78+ https://t.co/AWqZxF5B1L
Can you anticipate a breakout? Yes
— The_Chartist \U0001f4c8 (@charts_zone) June 10, 2022
the attached tweet.
now the chart is for USDINR https://t.co/Vb2wKaCvTB pic.twitter.com/INo0GC4fGY