SAnngeri Categories Screeners
7 days
30 days
All time
Recent
Popular


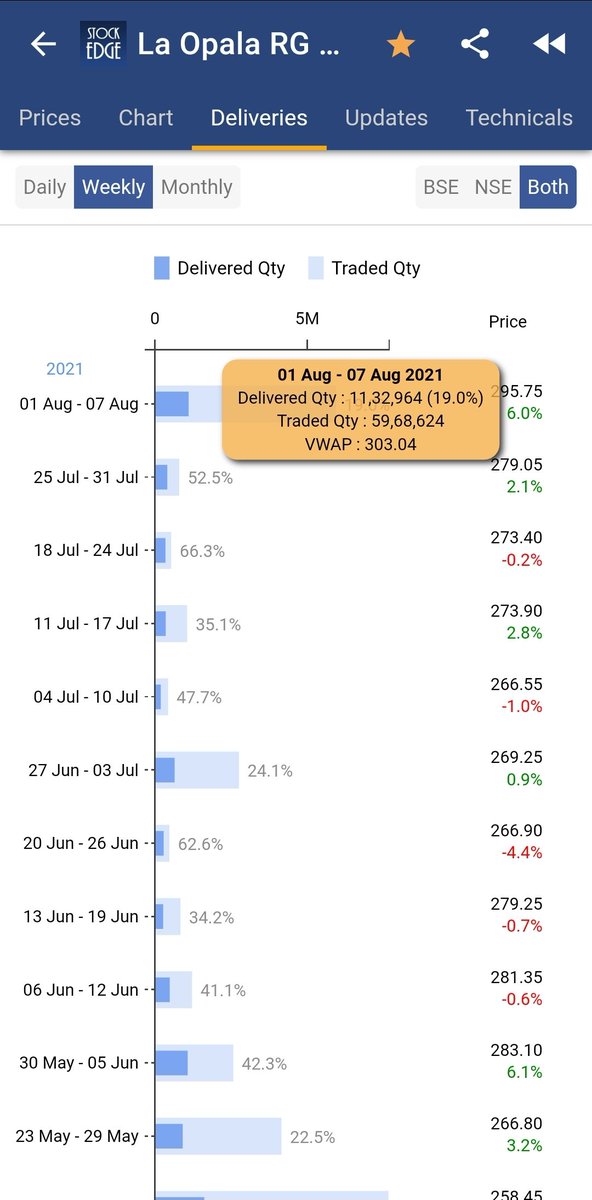
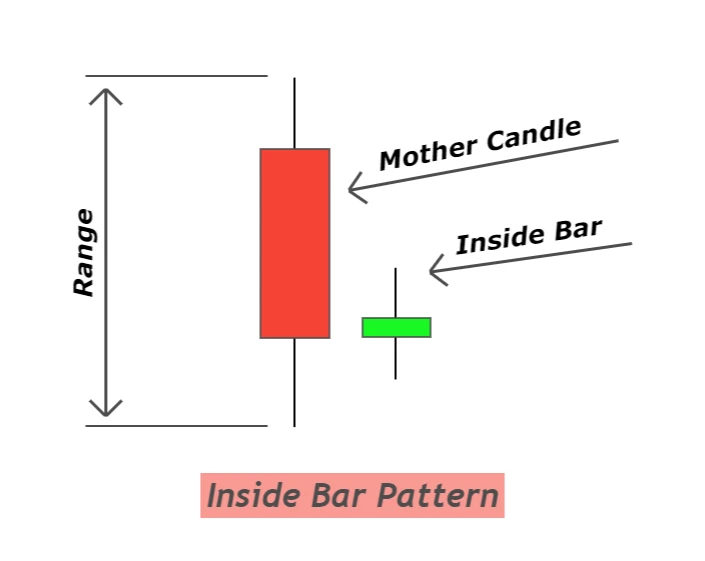
I try to look for exhaustion of supply, drying down of volumes, & narrowing of daily/weekly ranges. Enter after an upmove, on the lowest volume & the smallest daily range, as the stock forms a low volume doji/inside bar while in pullback/retest at/in/near the zone of 10MA & 20MA.
I m watching your posts... amazing sir.... thanks for sharing.... can you share what is your trade set up
— Sahasra (@h_shanmugavelu) March 21, 2022


Dear Friends,
#Sssnewfeature
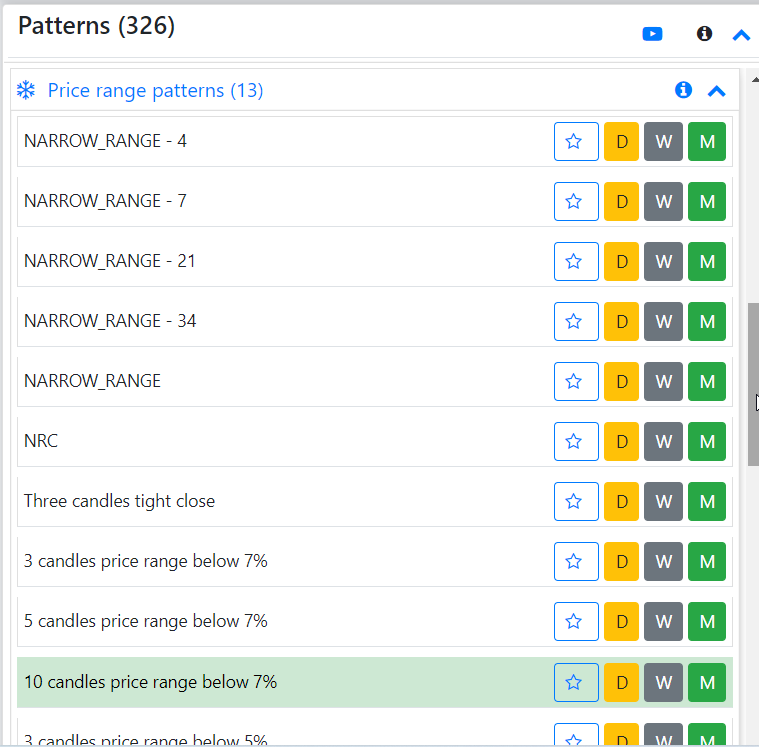
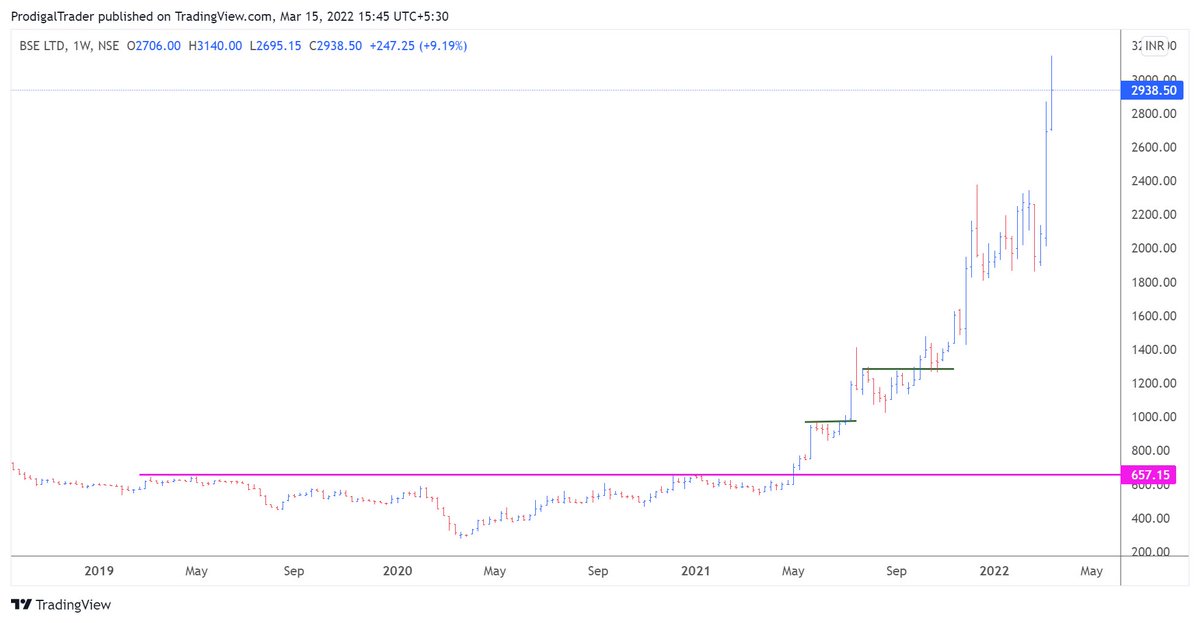
We have implemented the Price range scans to identify which are in the tight price range for the last few days. Use these scans along with the other scans like the Mark Minervini pattern(High momentum).
@krishchess @Techtrades365
1/n
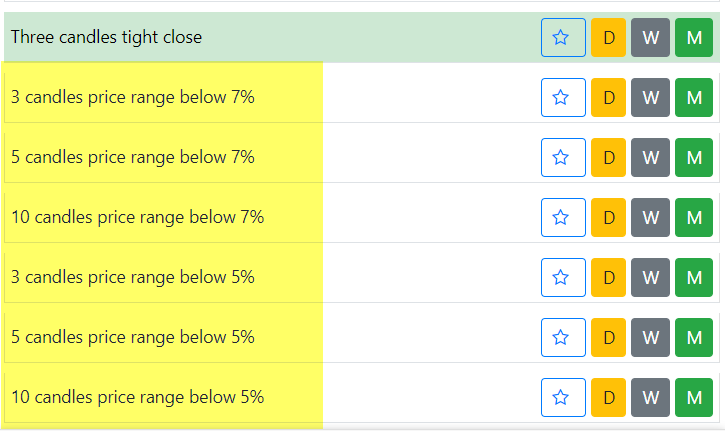
- These scans can help to find out the stocks whose range is < 5% or 7%.
1. 3 candles price range below 7%
2. 5 candles price range below 7%
3. 10 candles price range below 7%
4. 3 candles price range below 5%
5. 5 candles price range below 5%
6. 10 candles price range below 5%
Why range is important?
When you enter into a trade, for setting up a stop loss if we get the stocks within the 7% price range then we can keep our sl with less than 7%.
- As per Mark Minervini, don't keep the SL with more than 8%.
https://t.co/RkaOwvfBaq
Scans => price range
#Sssnewfeature
We have implemented the Price range scans to identify which are in the tight price range for the last few days. Use these scans along with the other scans like the Mark Minervini pattern(High momentum).
@krishchess @Techtrades365
1/n
- These scans can help to find out the stocks whose range is < 5% or 7%.
1. 3 candles price range below 7%
2. 5 candles price range below 7%
3. 10 candles price range below 7%
4. 3 candles price range below 5%
5. 5 candles price range below 5%
6. 10 candles price range below 5%
Why range is important?
When you enter into a trade, for setting up a stop loss if we get the stocks within the 7% price range then we can keep our sl with less than 7%.
- As per Mark Minervini, don't keep the SL with more than 8%.
https://t.co/RkaOwvfBaq
Scans => price range


The most important question now on the mind of all analysts and traders. Is this a bear market rally or is this the start of a bull move. Retweeting this as I will need a few tweets to explain my view
Everyone knows the HH-HL or LH-LL as per Dow theory. This can be a bit confusing on how one marks the Highs and Lows. Long back, I picked up this trick from one of the neo-Dow theorists on what to do in scenarios like this
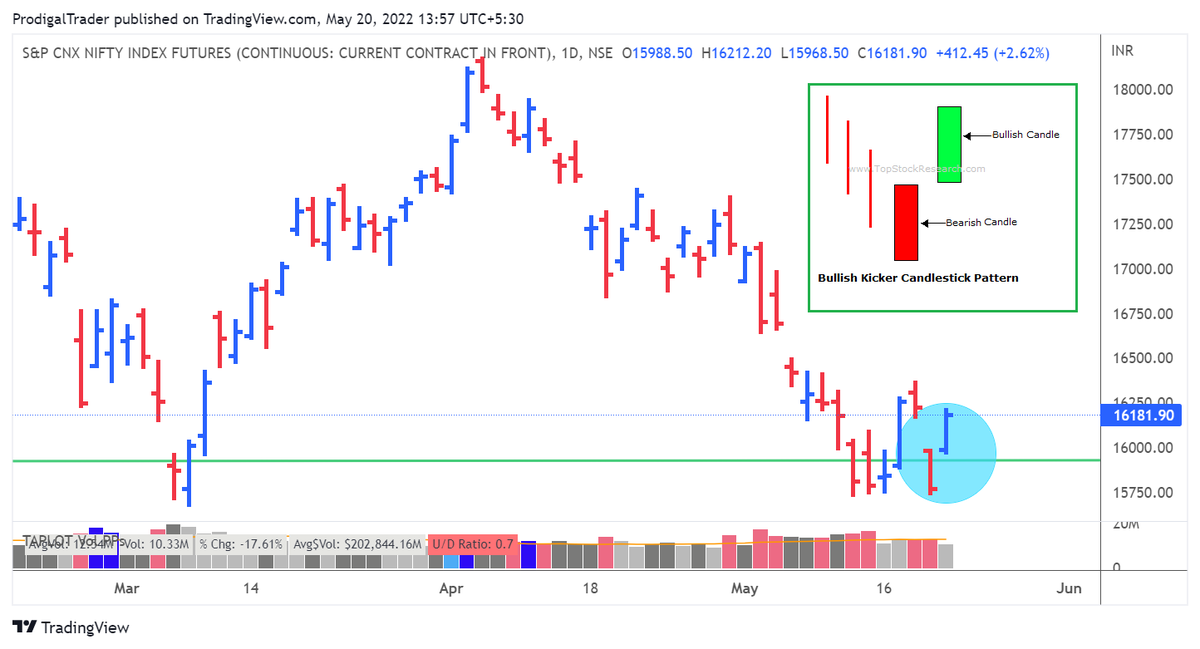
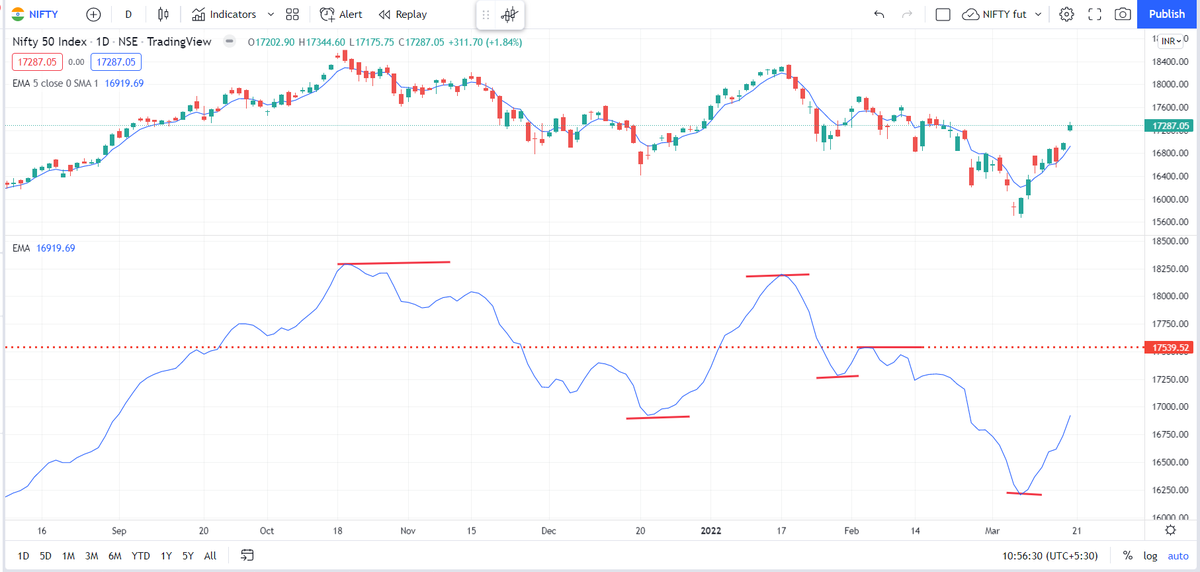
Simply plot a 5 period exponential moving average on a different panel. A 5-EMA simply shows you a running weekly perspective and kind of smoothens the price where a single spike high/low is not of that much importance
You will see this 5-ema also making HH.HL.LH.LL. So now, rather than focusing on the highs/lows on the charts, focusing on highs/lows on the 5-ema gives a cleaner perspective
As per this charts, unless the 5-ema now closes above 17540 ( the ema, not Nifty price) I will not play this as a bull market. I will deal with this market as a counter move against the major bear trend
Is Nifty bullish, or bearish?
— AP (@ap_pune) March 19, 2022
Replies MUST be ONLY with charts, not just 'views', no Russia Ukraine, crude, gold etc.
Can be levels....abv/below
Just technicals....maybe with trend lines, indicators or any other study (EW, harmonics etc)
Charts can be daily, weekly or monthly.
Everyone knows the HH-HL or LH-LL as per Dow theory. This can be a bit confusing on how one marks the Highs and Lows. Long back, I picked up this trick from one of the neo-Dow theorists on what to do in scenarios like this
Simply plot a 5 period exponential moving average on a different panel. A 5-EMA simply shows you a running weekly perspective and kind of smoothens the price where a single spike high/low is not of that much importance
You will see this 5-ema also making HH.HL.LH.LL. So now, rather than focusing on the highs/lows on the charts, focusing on highs/lows on the 5-ema gives a cleaner perspective
As per this charts, unless the 5-ema now closes above 17540 ( the ema, not Nifty price) I will not play this as a bull market. I will deal with this market as a counter move against the major bear trend


#FREETIPS
For new followers ...
If u r a pivot based intraday trader, u should have this cheat sheet. Follow this and C. Your wrong trades will reduce considerably. Good luck.
For new followers ...
If u r a pivot based intraday trader, u should have this cheat sheet. Follow this and C. Your wrong trades will reduce considerably. Good luck.
#FREETIPS
— ScorpioManoj (@scorpiomanojFRM) April 1, 2022
Pivot Rules snapshot
A free one page cheat sheet for pivot based trading that could probably be sold for a hefty price ....
Rem: This is just a broad set of rules. There are many advance rules more than this. pic.twitter.com/FnzmGGKx0P