Daily Charts
Most Popular on 4th of September, 2022
Most Popular on 3rd of September, 2022
Why you are wasting your money on KingOfAstras Brahmastra, here I have made a thread on Ancient Astra of India, which Bollywood never gonna tell you-

https://t.co/sIwIMG6zxm

https://t.co/BbMrY1lXTf
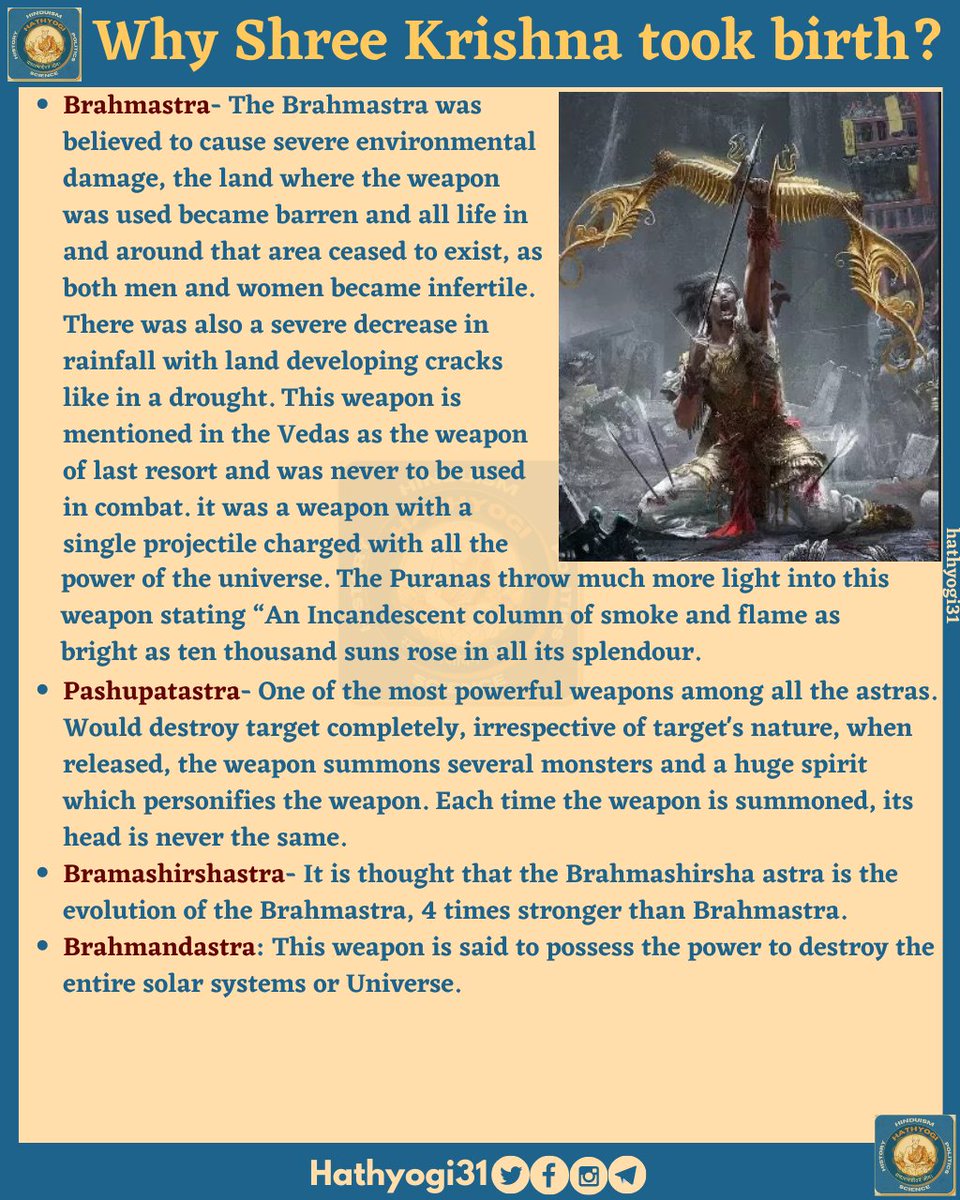
Ticket + popcorn will atleast cost you 500 bucks. Instead of funding these propagandists, you can contribute a bit to my work. I make educational posts on Hinduism, history, ancient wisdom, culture etc.
#BoycottBramhastra


https://t.co/sIwIMG6zxm

https://t.co/BbMrY1lXTf

Ticket + popcorn will atleast cost you 500 bucks. Instead of funding these propagandists, you can contribute a bit to my work. I make educational posts on Hinduism, history, ancient wisdom, culture etc.
#BoycottBramhastra

Most Popular on 2nd of September, 2022
Trading is about mastering ONE setup
And I'm giving you the one that turned me into a profitable trader FREE...
Take 2 mins out of your day to learn my EXACT setup:🧵
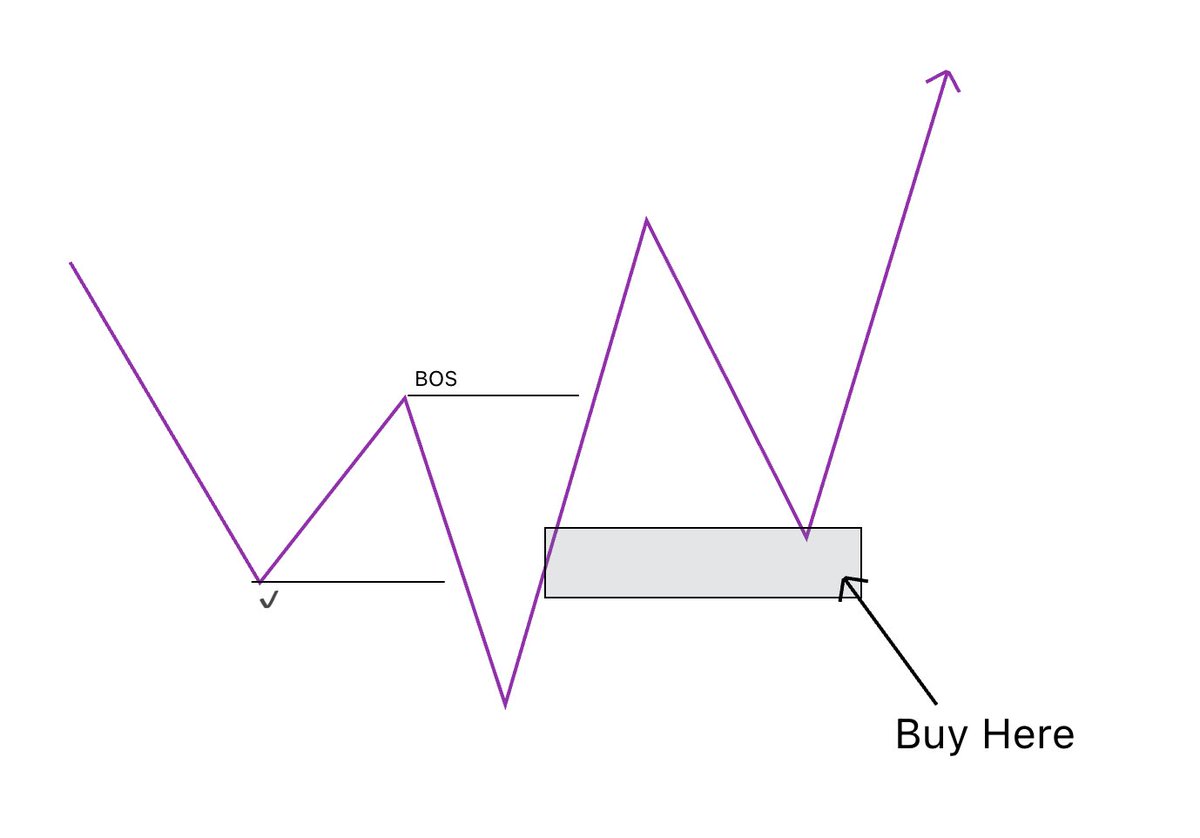
This setup is involves a few elements but is mainly comprised of the idea "change in trend"
I'm simply waiting for confirmation of a trend change and then taking advantage of it
Here's the breakdown:
First, I need to identify trend.
This step is simple. Is price making higher highs? Higher lows?
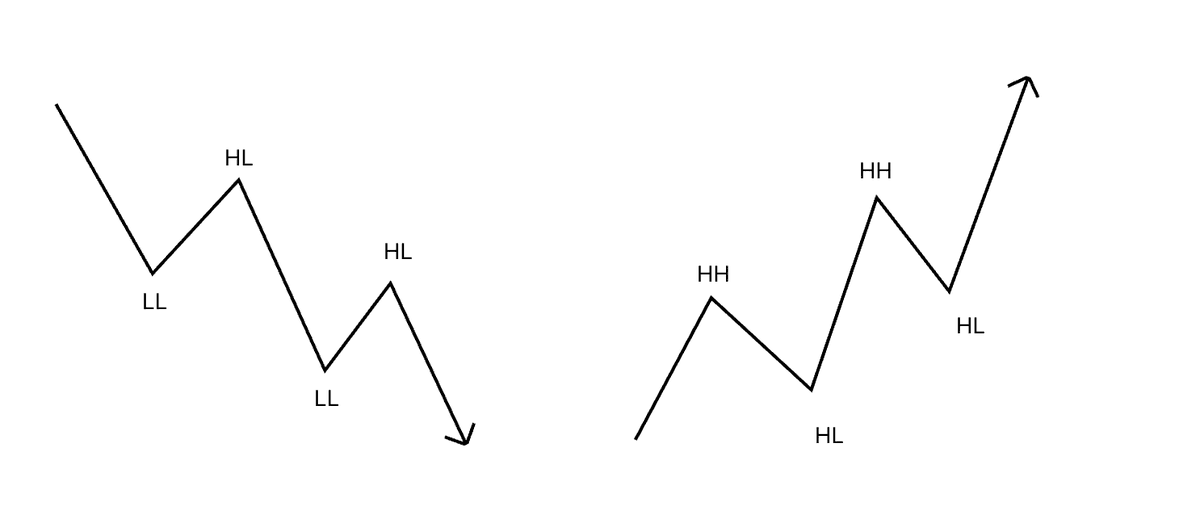
Once trend is established, I wait to see a CHANGE IN TREND
For example, in a downtrend I may see a higher high form.
That's the first sign of a change in trend
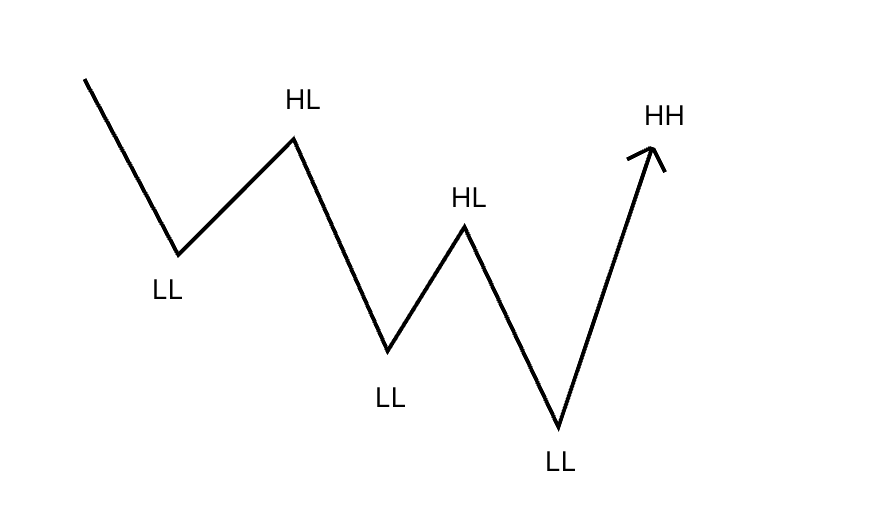
Price was able to break the structure of the previous higher low.
Indicating the first sign of a trend change.
If you don't know how to identify a break of structure, read this (after finishing this
And I'm giving you the one that turned me into a profitable trader FREE...
Take 2 mins out of your day to learn my EXACT setup:🧵

This setup is involves a few elements but is mainly comprised of the idea "change in trend"
I'm simply waiting for confirmation of a trend change and then taking advantage of it
Here's the breakdown:
First, I need to identify trend.
This step is simple. Is price making higher highs? Higher lows?

Once trend is established, I wait to see a CHANGE IN TREND
For example, in a downtrend I may see a higher high form.
That's the first sign of a change in trend

Price was able to break the structure of the previous higher low.
Indicating the first sign of a trend change.
If you don't know how to identify a break of structure, read this (after finishing this
Adding market structure to your trading could literally turn you into a $10k/month trader
— Jordan F\u2503Stock Trader (@FT__Trading) June 9, 2022
But learning what a real structure break is can take months...
So here's a thread on how to identify a break of structure:\U0001f447 pic.twitter.com/4J1ywQK1FO
[The Future of Luna]
In the community there are many investors that are doubting that $Luna can make a comeback.
However I can assure you that @stablekwon is far from being done.
Let‘s explore how $LUNA is heading into the future by talking a look what’s currently being built!

Before we talk about whats being built next, let’s talk about whats not being built.
Here is a screenshot from Do stating that TFL is currently not building UST 2.0.
However I am pretty sure, they are going to launch UST 2.0 and I will tell you why at the end of the thread.
Lets first talk about some key information pieces that will bring us to the conclusion that the end goal is UST 2.0.
Luna is implementing new groundbreaking technology in the NFT space. You could say they are inventing NFT 2.0.
One of the most important pieces of NFT 2.0 is the Darwin SDK which will make evolving NFTs
In the community there are many investors that are doubting that $Luna can make a comeback.
However I can assure you that @stablekwon is far from being done.
Let‘s explore how $LUNA is heading into the future by talking a look what’s currently being built!

Before we talk about whats being built next, let’s talk about whats not being built.
Here is a screenshot from Do stating that TFL is currently not building UST 2.0.
— Dharma Mind (@Dharma_Mind) August 13, 2022
However I am pretty sure, they are going to launch UST 2.0 and I will tell you why at the end of the thread.
Lets first talk about some key information pieces that will bring us to the conclusion that the end goal is UST 2.0.
Luna is implementing new groundbreaking technology in the NFT space. You could say they are inventing NFT 2.0.
One of the most important pieces of NFT 2.0 is the Darwin SDK which will make evolving NFTs
#1 Darwin SDK
— John Galt (@lurkaroundfind) August 6, 2022
Will allow developers to create evolving NFTs. Users can evolve NFTs by "feeding" them tokens and other NFTs. Plus, use the GPS and gyroscope from a user's phone to create and evolve NFTs.
Most Popular on 1st of September, 2022
Nifty Futures Positional Trading Using Point & Figure Charts
Following this system on stocks since 2021 and started on Index in 2022
Based on Richard Dennis's Turtle Trading System and the P&F version was created by @Prashantshah267
Details
Chart Settings
Instrument: Nifty Futures ( Current Month)
Chart : Point & Figure
Box Size: 0.10%
Reversal Box: 3
Data Frequency- 1 Min
P&F Charts don't have concept of time but it has a concept Data Frequency, i.e. duration after which to consider plotting X or O on the chart
Since DF is 1 Min here, so we need to wait for 1 Min closing on P&F Charts for Entry, Exit Signals
The chart is an Intraday Chart & requires Intraday data
Which is available on the Real Time Tradepoint Software & on the Web Version of this software
https://t.co/oAshC7rfD1
-
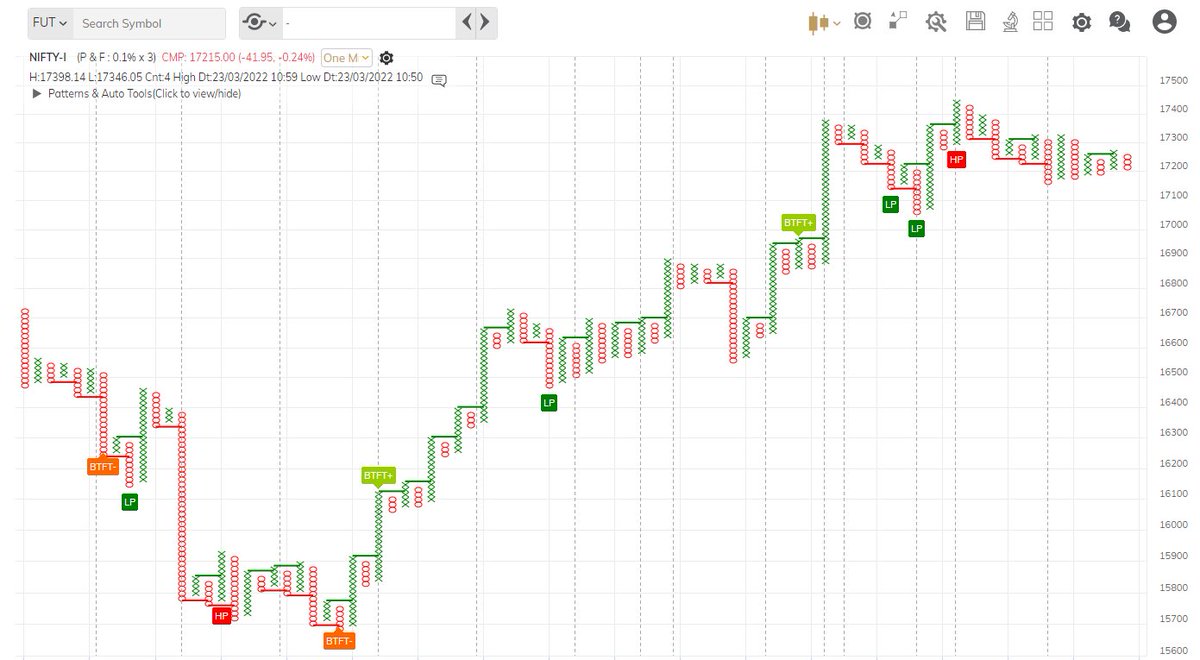
Let's now Discuss Bullish Entry Pattern
The Entry Pattern is called as a Bullish Follow Through Turtle Buy Pattern
This actually comprises of 2 Parts
1. Bullish Turtle Breakout
2. Bullish Turtle Follow Through
For Entry, #1 must happen and there must be a #2 immediately
First Let's Understand the Bullish Turtle Breakout Pattern
This is a 5 X BO Pattern
If current column of X goes above highest ‘X’ in last 5 columns (including current column), then it is a 5-X Turtle breakout.
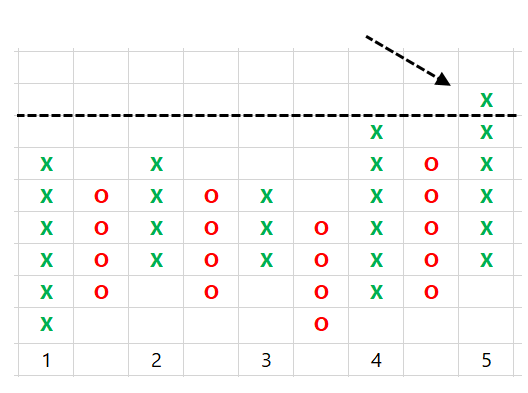
Following this system on stocks since 2021 and started on Index in 2022
Based on Richard Dennis's Turtle Trading System and the P&F version was created by @Prashantshah267
Details
Chart Settings
Instrument: Nifty Futures ( Current Month)
Chart : Point & Figure
Box Size: 0.10%
Reversal Box: 3
Data Frequency- 1 Min
P&F Charts don't have concept of time but it has a concept Data Frequency, i.e. duration after which to consider plotting X or O on the chart
Since DF is 1 Min here, so we need to wait for 1 Min closing on P&F Charts for Entry, Exit Signals
The chart is an Intraday Chart & requires Intraday data
Which is available on the Real Time Tradepoint Software & on the Web Version of this software
https://t.co/oAshC7rfD1
-

Let's now Discuss Bullish Entry Pattern
The Entry Pattern is called as a Bullish Follow Through Turtle Buy Pattern
This actually comprises of 2 Parts
1. Bullish Turtle Breakout
2. Bullish Turtle Follow Through
For Entry, #1 must happen and there must be a #2 immediately
First Let's Understand the Bullish Turtle Breakout Pattern
This is a 5 X BO Pattern
If current column of X goes above highest ‘X’ in last 5 columns (including current column), then it is a 5-X Turtle breakout.

Most Popular on 31st of August, 2022
Most Popular on 30th of August, 2022
Most Popular on 29th of August, 2022
If you pick stocks, you MUST learn how to read an income statement.
Here’s everything you need to know:
The income statement shows a company’s revenue and expenses over a period of time, usually a quarter or year.
It’s also called:
▪️Profit and Loss statement, or “P & L”
▪️Statement of earnings
It follows this basic format:
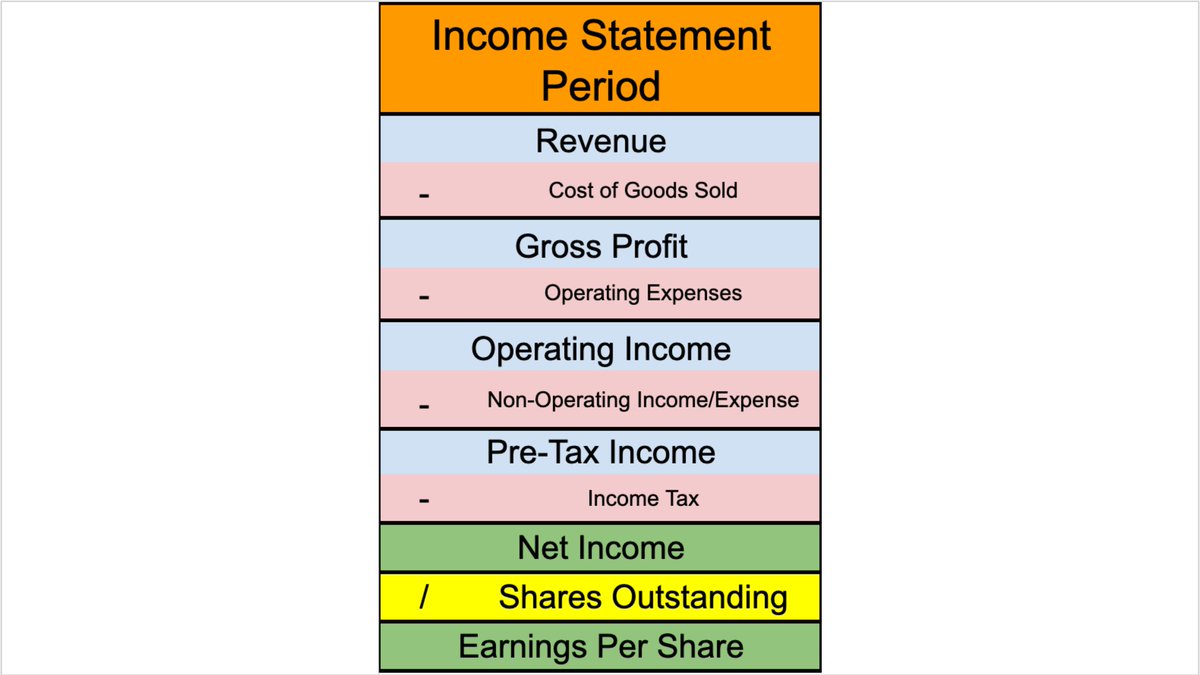
Most public companies show their income statement in their quarterly earnings press release, but not always
Find them by looking at:
▪️10-Q (quarterly report)
▪️10-K (annual report)
▪️Aggregator websites like @theTIKR
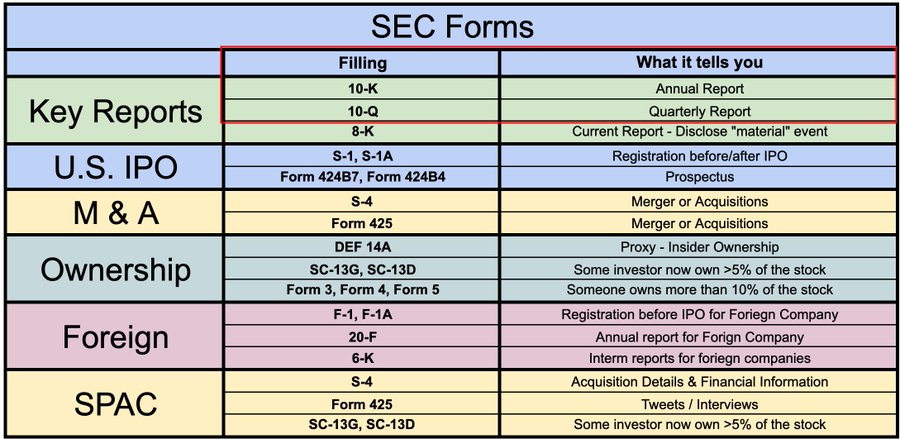
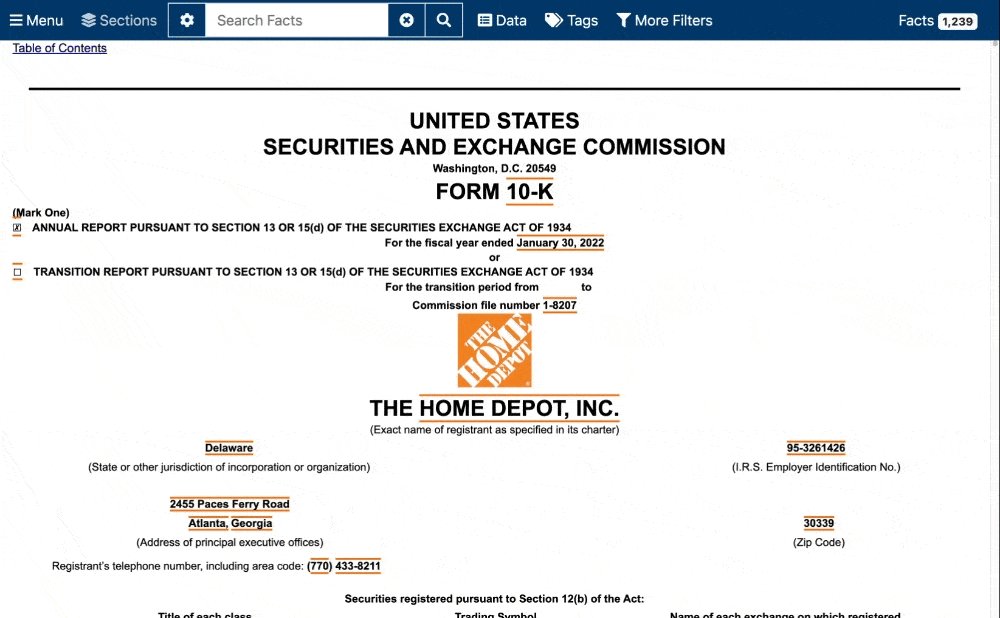
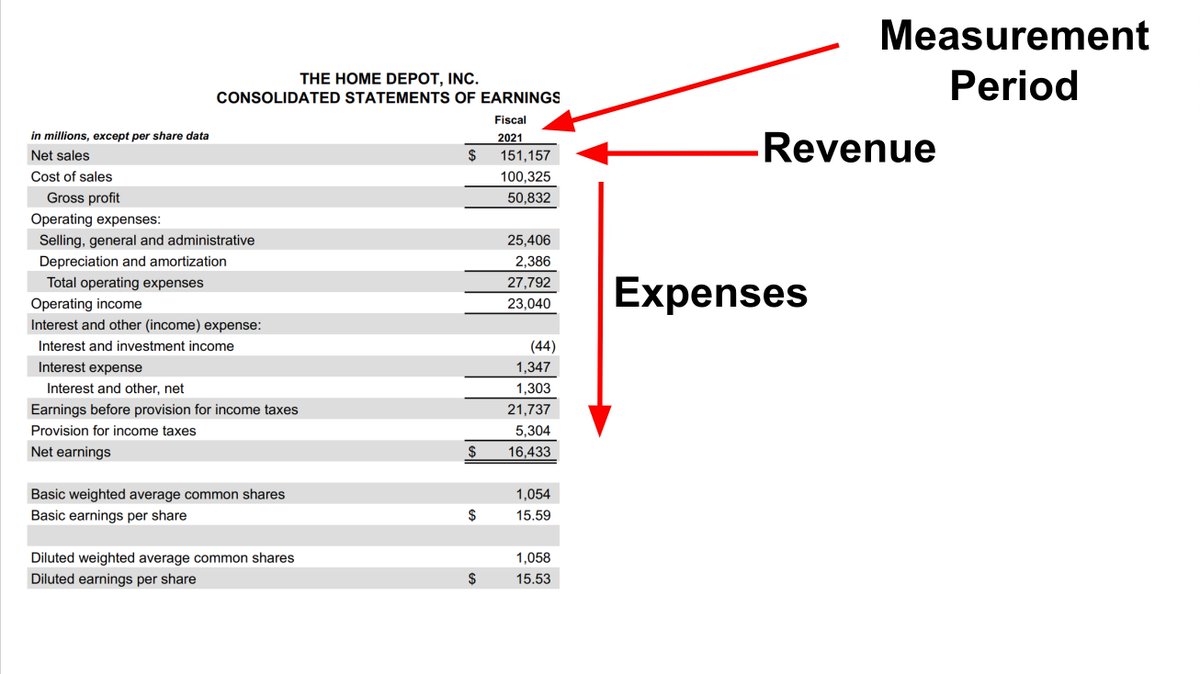
Let's use Home Depot fiscal 2021 as an example
Step 1: Get the data
▪️ Go to https://t.co/OO3BfNGWVl
▪️ Search "HD"
▪️ Click the "10-K" from March 23rd
▪️ Scroll to "Statement of earnings"
The income statement flows in a step-down manner.
The top number is revenue (sales), and costs + expenses are subtracted as you go down
Here’s everything you need to know:
The income statement shows a company’s revenue and expenses over a period of time, usually a quarter or year.
It’s also called:
▪️Profit and Loss statement, or “P & L”
▪️Statement of earnings
It follows this basic format:

Most public companies show their income statement in their quarterly earnings press release, but not always
Find them by looking at:
▪️10-Q (quarterly report)
▪️10-K (annual report)
▪️Aggregator websites like @theTIKR

Let's use Home Depot fiscal 2021 as an example
Step 1: Get the data
▪️ Go to https://t.co/OO3BfNGWVl
▪️ Search "HD"
▪️ Click the "10-K" from March 23rd
▪️ Scroll to "Statement of earnings"

The income statement flows in a step-down manner.
The top number is revenue (sales), and costs + expenses are subtracted as you go down


