Daily Charts
Most Popular on 18th of September, 2022
Most traders do or did BREAKOUT TRADING
Here in this Thread 🧵 a effective technique i use to trade both breakout & false breakout
It will take 5 minutes to read
Kindly RETWEET this tweet if you find the content useful so it can reach and benefit many traders
Scroll down 👇

I do daily Live Market session via Youtube Live ( Monday to Friday morning 9:00 a.m to 01:00 p.m.
Follow us @learntotrade365 . Join the Telegram Channel for live market updates
https://t.co/VU0bCGjU7s
Scroll down 👇
Main problem most breakout traders face is false breakout. So if we understand other side of breakout trading false breakout can also be used as a trading opportunity . Read this thread i have shared few examples.
Chart example - 1
Scroll down👇
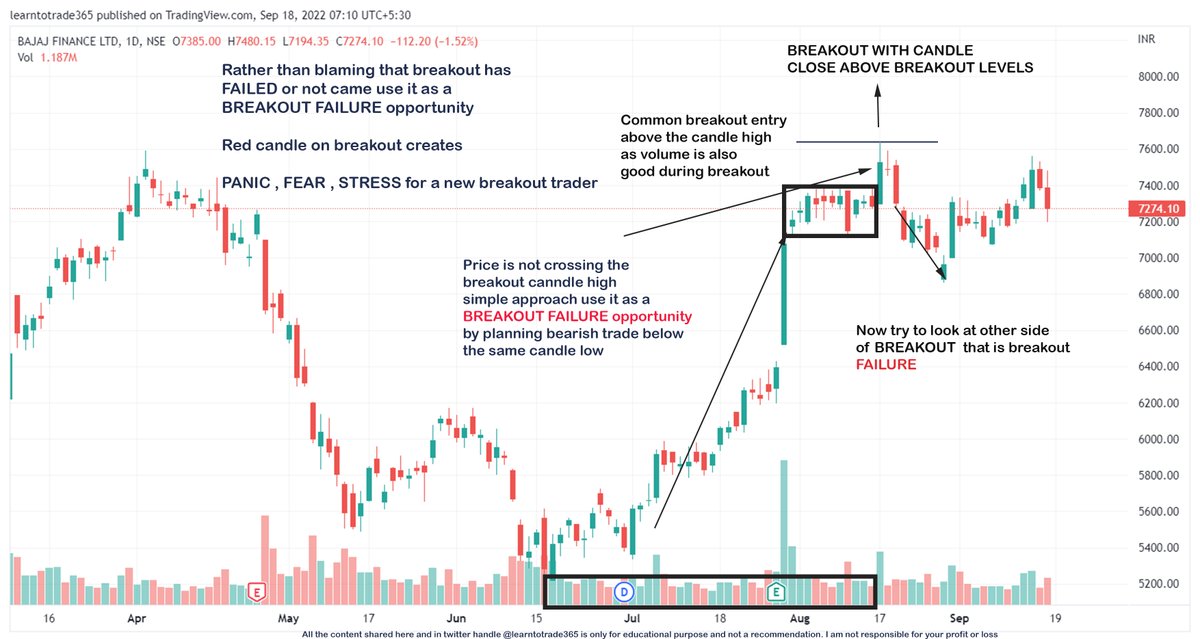
Rather getting confused whether the breakout will be a success or failure - look in perspective of double opportunity
Chart example -2
Scroll down 👇
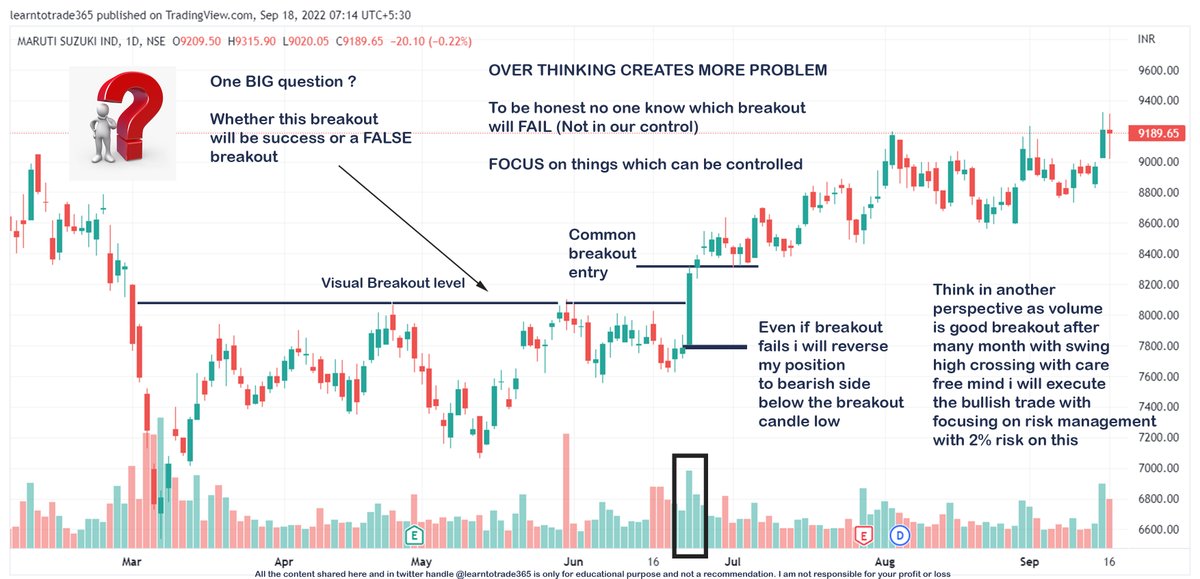
Breakout trading using simple Swing levels. Below example is about making use of false breakout as a trade opportunity. Controlled position sizing can only help a trader to become profitable
Chart example 3
Scroll down 👇
Here in this Thread 🧵 a effective technique i use to trade both breakout & false breakout
It will take 5 minutes to read
Kindly RETWEET this tweet if you find the content useful so it can reach and benefit many traders
Scroll down 👇

I do daily Live Market session via Youtube Live ( Monday to Friday morning 9:00 a.m to 01:00 p.m.
Follow us @learntotrade365 . Join the Telegram Channel for live market updates
https://t.co/VU0bCGjU7s
Scroll down 👇
Main problem most breakout traders face is false breakout. So if we understand other side of breakout trading false breakout can also be used as a trading opportunity . Read this thread i have shared few examples.
Chart example - 1
Scroll down👇

Rather getting confused whether the breakout will be a success or failure - look in perspective of double opportunity
Chart example -2
Scroll down 👇

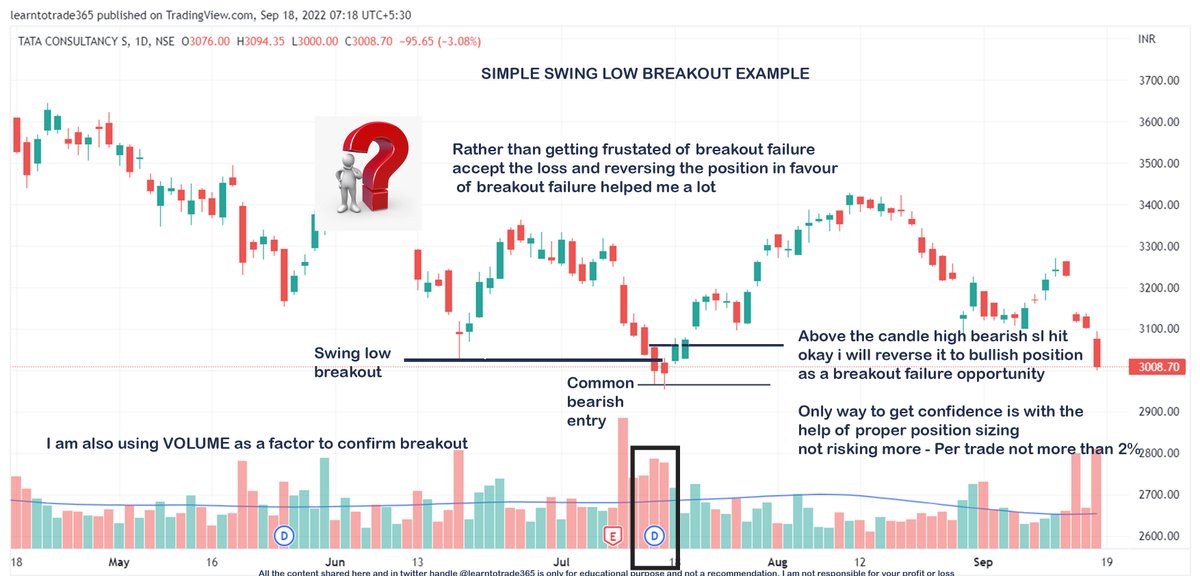
Breakout trading using simple Swing levels. Below example is about making use of false breakout as a trade opportunity. Controlled position sizing can only help a trader to become profitable
Chart example 3
Scroll down 👇

Most Popular on 17th of September, 2022
In case you missed it. I wrote a Thread... This is our Path 6: Mark Meadows. So this is the criminal path of Trump stealing classified documents to Mar-A-Lago and related espionage. Here when we count prison time, even centuries are not enough.. SRSLY. Enjoy..
Path 6 - Mark Meadows First Thread/1
— Tomi T Ahonen Standing With Ukraine (@tomiahonen) September 10, 2022
This is the Sixth Path to take Trump to prison for life. It is named Mark Meadows who is a key player to get Trump convicted in espionage, related to stealing 325 classified documents in Trump's attempt to sell US secrets to US enemies pic.twitter.com/d8E5OTsVLu
Most Popular on 16th of September, 2022
Most Popular on 15th of September, 2022
Most Popular on 14th of September, 2022
Most Popular on 13th of September, 2022
Most Popular on 12th of September, 2022
Nifty basic volume profile analysis for today:
Yesterday, shared about various types of volume profile analysis and how to prepare for next day. Read here
We had discussed that a "p" shaped profile and close at highs indicates longs are in control of the market.
It also indicates high chances of uptrend continuation next day.
But
(2/n)
How to trade a failure of trend continuation? Yesterday, we saw a "P" shape profile in Nifty and close at highs.
But we failed to continue upmove today.
(3/n)

We opened positive but the opening breakout not sustaining is first cue to understand that bulls are lacking initiative to push prices up further.
(4/n)
For confirmation, one can use orderflow as well to see real time supply demand flowing into the market.
At open today, we saw fresh sellers coming in a bullish opening.
(5/n)

Yesterday, shared about various types of volume profile analysis and how to prepare for next day. Read here
How to analyze Nifty using various types of volume profile:
— Trader Abhishek (@KillerTrader_) September 5, 2022
A thread \U0001f9f5
(1/n)
We had discussed that a "p" shaped profile and close at highs indicates longs are in control of the market.
It also indicates high chances of uptrend continuation next day.
But
(2/n)
How to trade a failure of trend continuation? Yesterday, we saw a "P" shape profile in Nifty and close at highs.
But we failed to continue upmove today.
(3/n)

We opened positive but the opening breakout not sustaining is first cue to understand that bulls are lacking initiative to push prices up further.
(4/n)
For confirmation, one can use orderflow as well to see real time supply demand flowing into the market.
At open today, we saw fresh sellers coming in a bullish opening.
(5/n)


