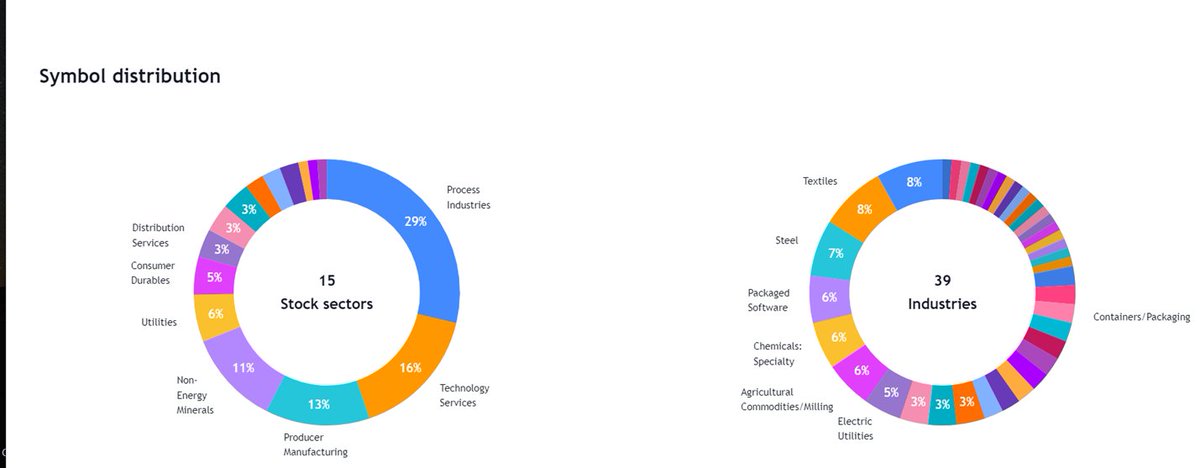
These Belonged to various sectors and Groups
Excel Link for List of Stocks
https://t.co/jESOUM32b5
1/n

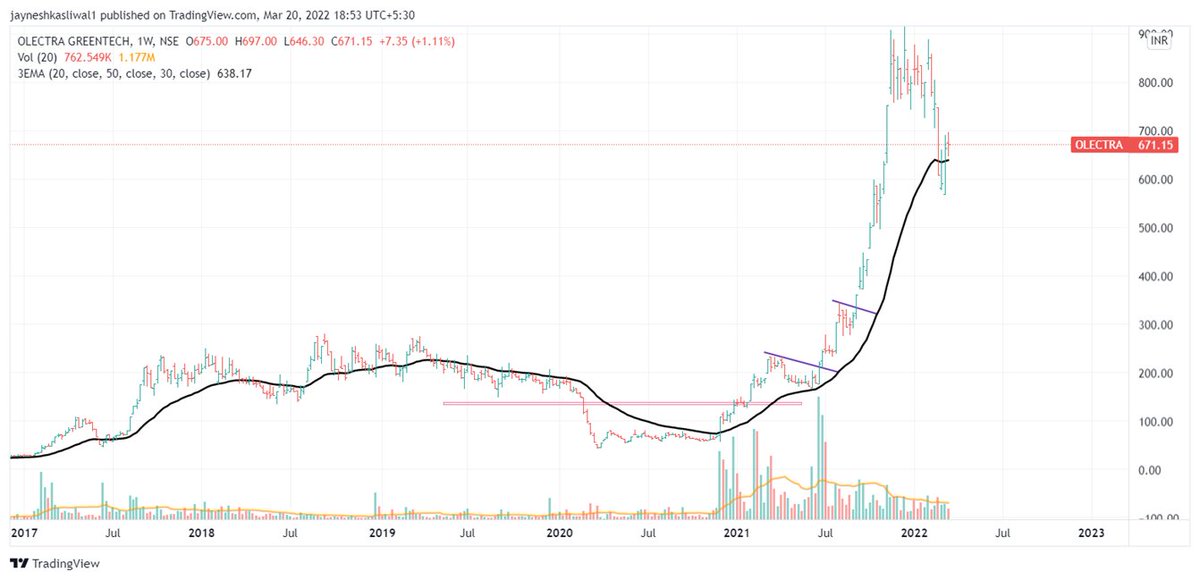
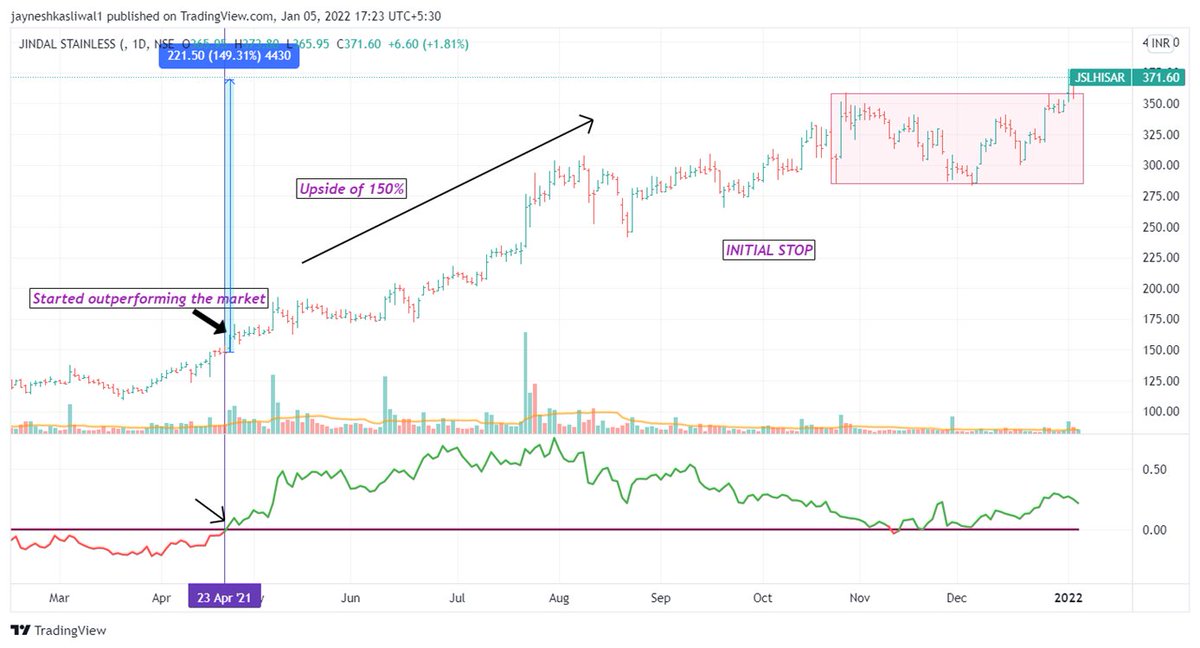
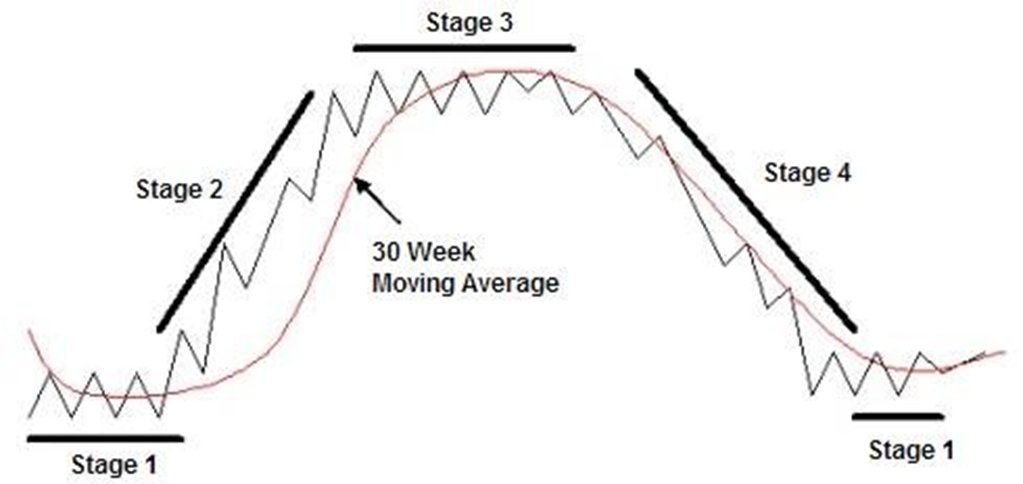
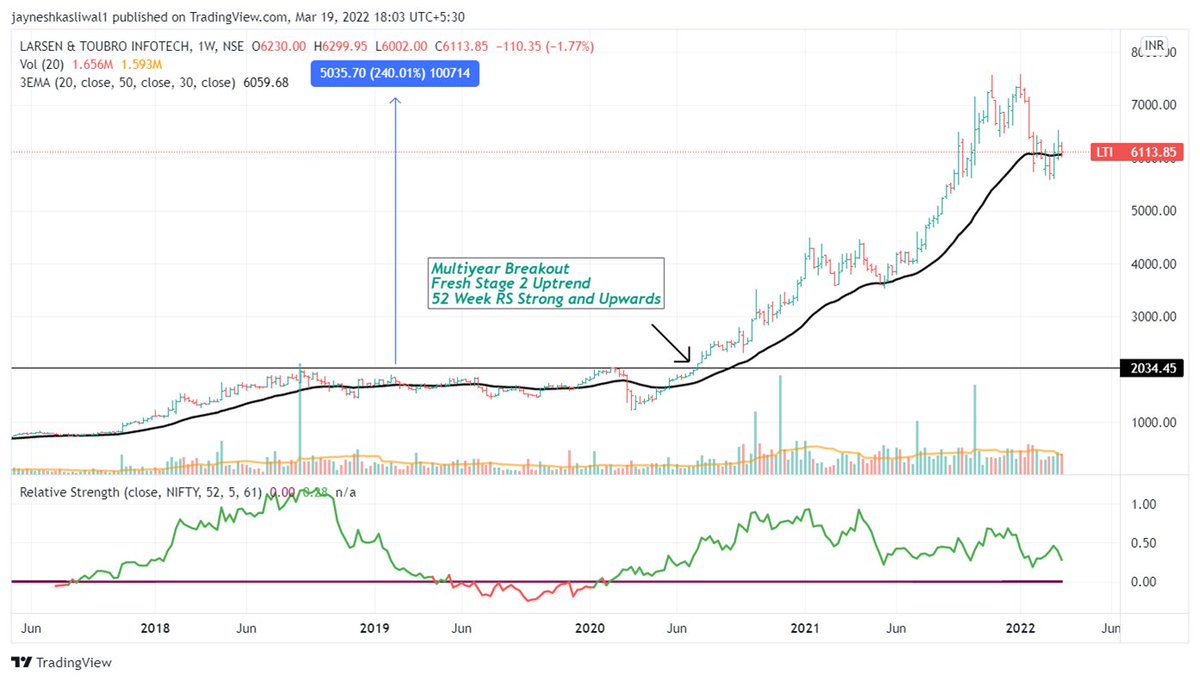


Understanding STAGE ANALYSIS
— JayneshKasliwal (@JayneshKasliwal) February 13, 2022
I read one of the greatest Trading Books so that You dont have to !\U0001f9f5
Secrets of Profiting in Bull and Bear Markets
by Stan Weinstien
Retweet and Share !
Comment Yes for another Book Summary :) pic.twitter.com/eLfSiQV5nm
A THREAD:
— Aditya Todmal (@AdityaTodmal) November 28, 2020
7 FREE OPTION TRADING COURSES FOR BEGINNERS.
Been getting lot of dm's from people telling me they want to learn option trading and need some recommendations.
Here I'm listing the resources every beginner should go through to shorten their learning curve.
(1/10)
The absolute best 15 scanners which experts are using.
— Aditya Todmal (@AdityaTodmal) January 29, 2021
Got these scanners from the following accounts:
1. @Pathik_Trader
2. @sanjufunda
3. @sanstocktrader
4. @SouravSenguptaI
5. @Rishikesh_ADX
Share for the benefit of everyone.
12 TRADING SETUPS which experts are using.
— Aditya Todmal (@AdityaTodmal) February 7, 2021
These setups I found from the following 4 accounts:
1. @Pathik_Trader
2. @sourabhsiso19
3. @ITRADE191
4. @DillikiBiili
Share for the benefit of everyone.
Curated tweets on How to Sell Straddles
— Aditya Todmal (@AdityaTodmal) February 21, 2021
Everything covered in this thread.
1. Management
2. How to initiate
3. When to exit straddles
4. Examples
5. Videos on Straddles
Share if you find this knowledgeable for the benefit of others.