Let's start with the basics.
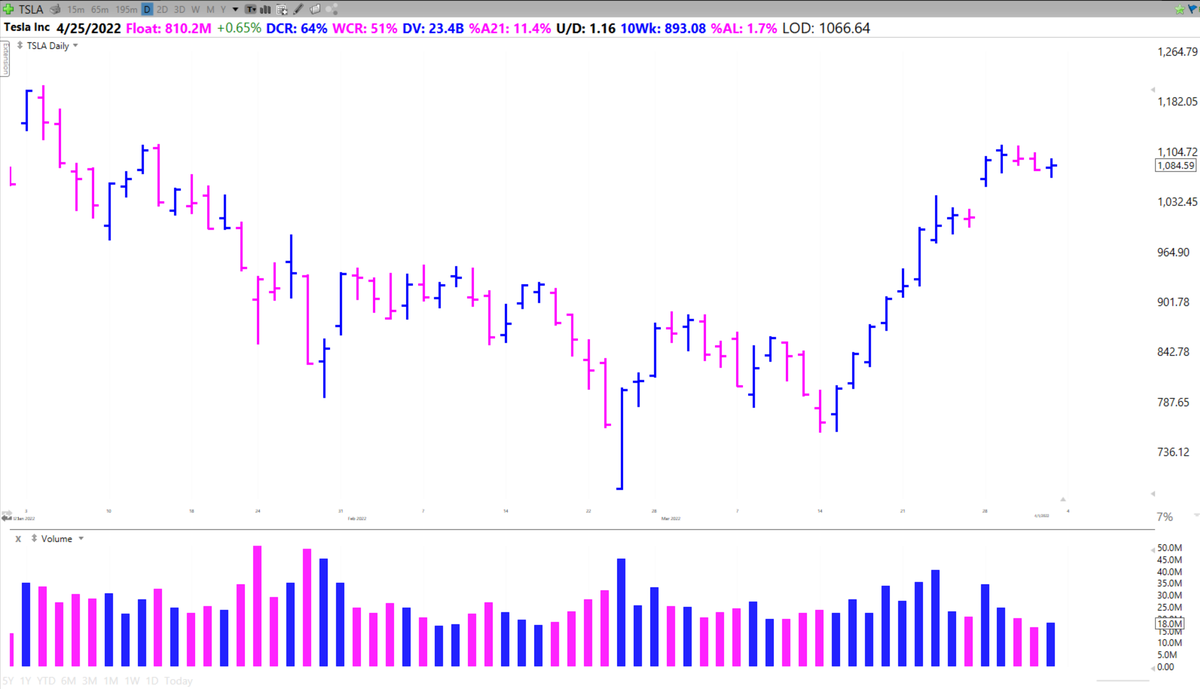
When you first pull up a stock chart you will see Price and Volume plotted versus time.
Each price bar represents one period of whatever timeframe you are on
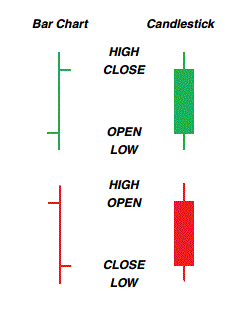
Some people like candlesticks, I personally think Open/High/Low/Close (OHLC) Bars are more intuitive
For each bar/candle, the four important data points of each period are represented:
High
Low
Open
Close.
For each bar, we want to be able to determine whether buyers or sellers are in control and how much conviction they have.
To do this we use our tools: Price and Volume
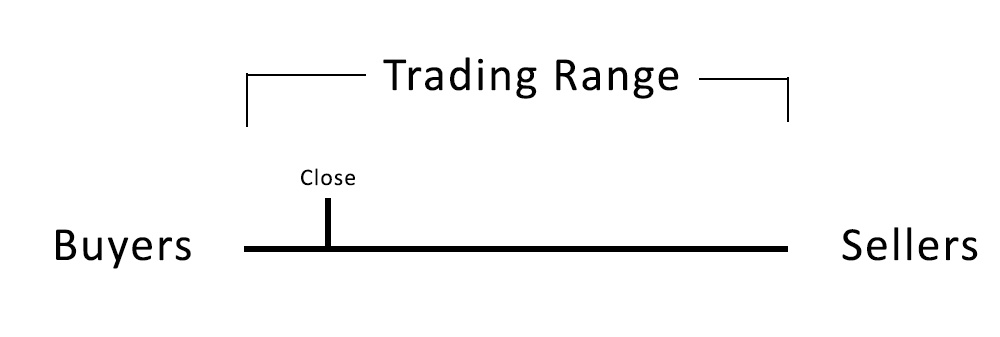
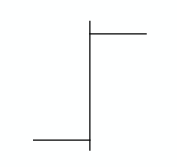
Thing about turning a price Bar 90 degrees counter clockwise so the high is now on the left and the low is now on the right.
Then picture a game of tug of war with participants representing buying pressure on the left and selling pressure on the right.
The goal of the game is to pull the close all the way to the left or right.
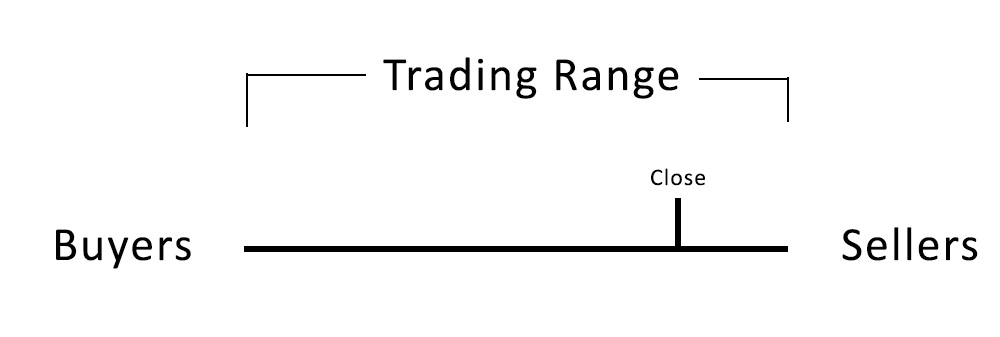
If the team on the left (The Buyers) is winning and is able to pull the close nearly to the left (The high) then Buyers are in control.
If the team on the right (The Sellers) is winning and is able to pull the close nearly to the right (The low) then sellers are in control.
So to summarize, where the close is with respect to the high/low on a bar indicates who is stronger, the buyers or sellers.
The number of participants on a single bar also makes that bar much more significant.
This means the battle is larger and whoever wins is likely to keep winning over the next few sessions.
This is why as traders we put more weight on bars with high volume (more shares traded)
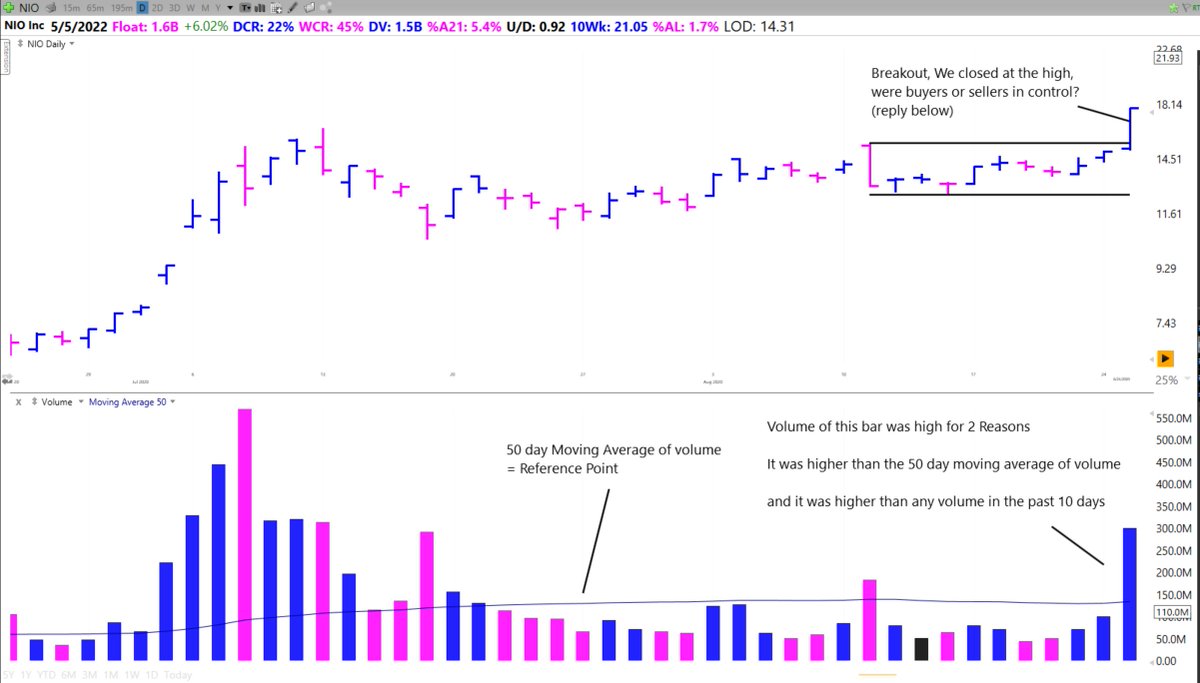
How do we define high volume?
There are two main ways:
Compare the volume on a particular day to a moving average reference point
or
Compare the volume to the previous 5-10-20 days to see if it is abnormal.
The higher the volume the more important the bar.
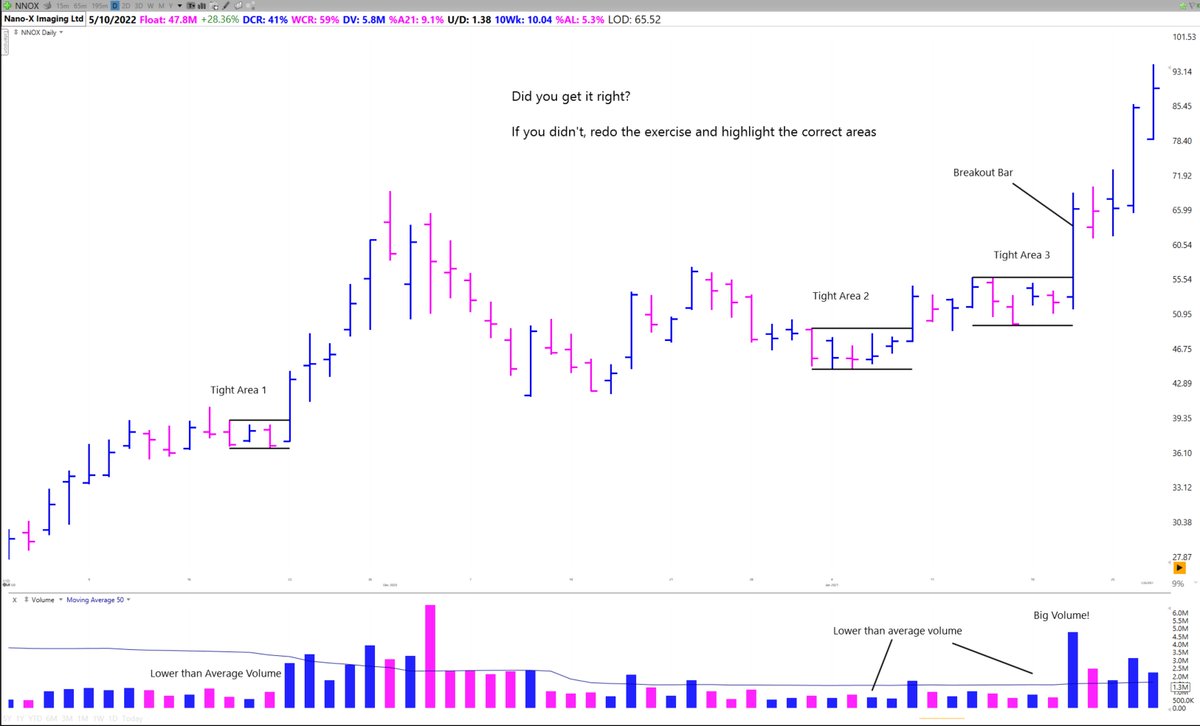
So that covers high volume what about low volume?
Low volume indicates that there are not many participants
Look for tight action where the price bars' ranges or closes do not change much in value or drift slightly lower on low volume
This type of action indicates a lack of sellers & an equilibrium in price
It's what we call a volatility contraction, coined by
@markminervini, where supply has been wrung out.
@markminervini As you look at a price chart, Circle in your mind anytime you see tight areas like this on a chart.
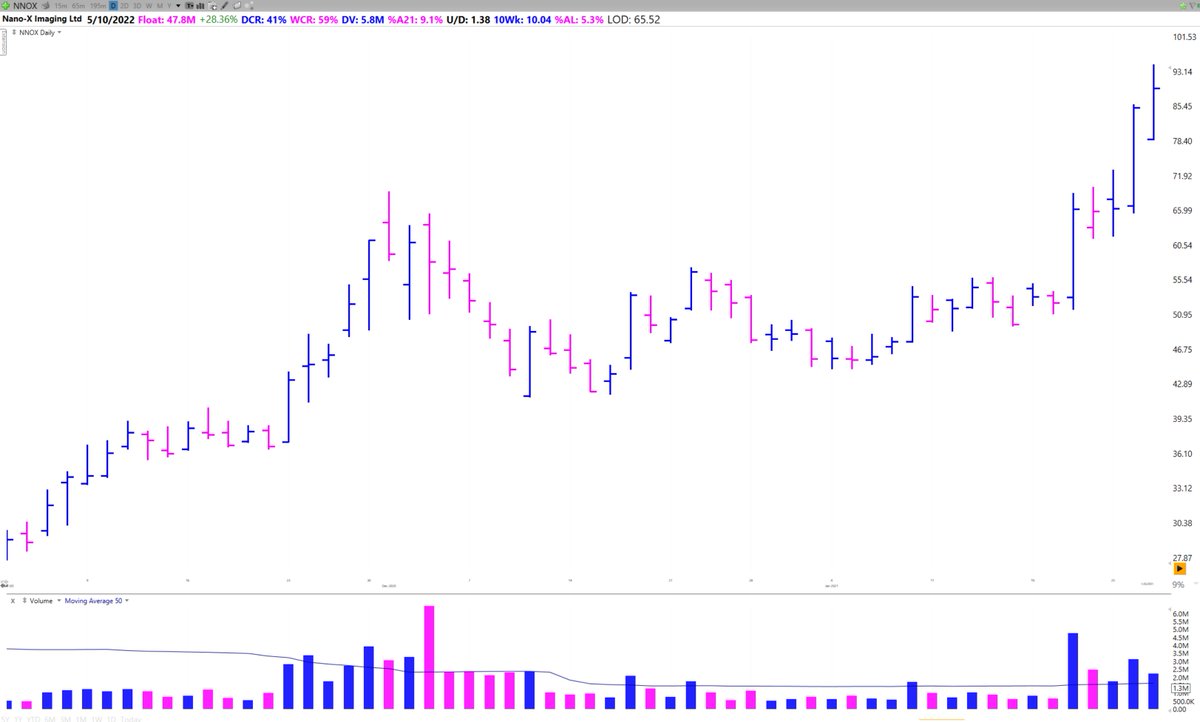
Here is a quick quiz.
On this chart of $NNOX highlight any tight areas you see where price compresses for at least 2-3 bars.
Reply below with your answers 👇 Don't Cheat!
@markminervini Here is my answer.
Notice how after a tight area we often get a directional move on higher volume breaking out of the tight area (range) you drew.
This move often continues for 3-5 days in a momentum burst
@PradeepBonde
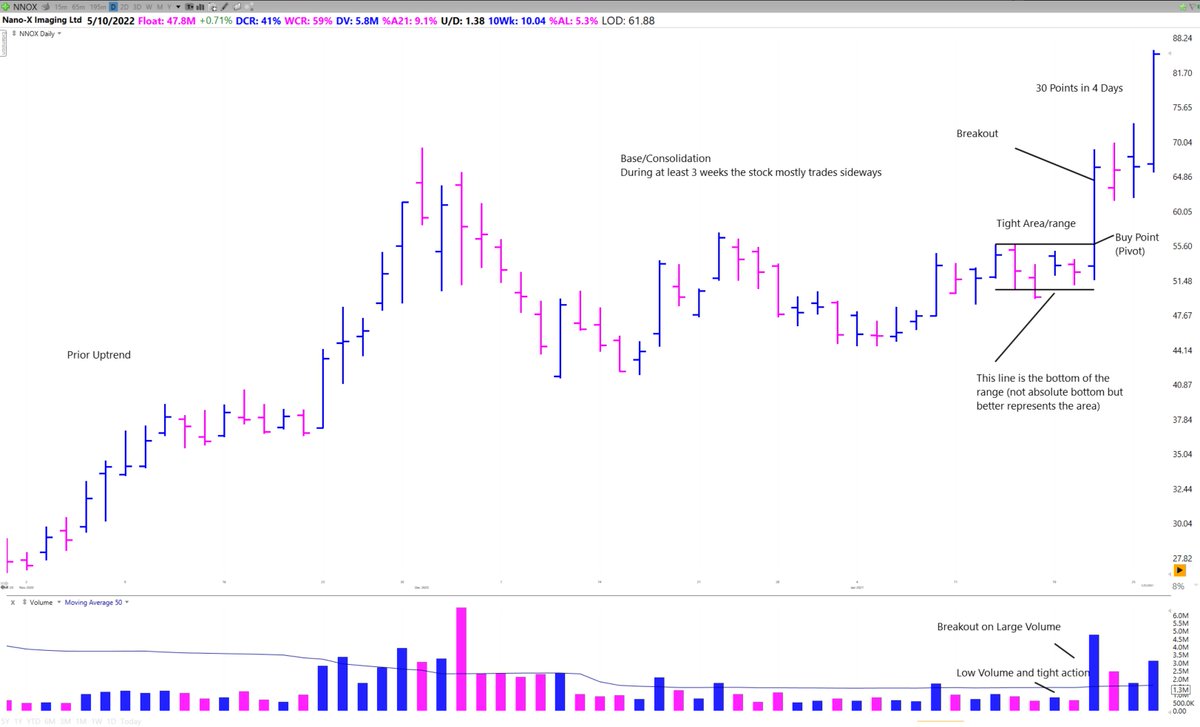
@markminervini @PradeepBonde From a tight area the stock makes a decision to either break up or down from the range.
If a stock is in an uptrend it is likely to continue that uptrend after the pause/tight area/consolidation. Likewise if it is in a downtrend it will more likely break down
@markminervini @PradeepBonde This type of absolute volatility is something we as traders can capitalize on once the stock makes a decision to break out through the top of a range, or break down through the bottom.
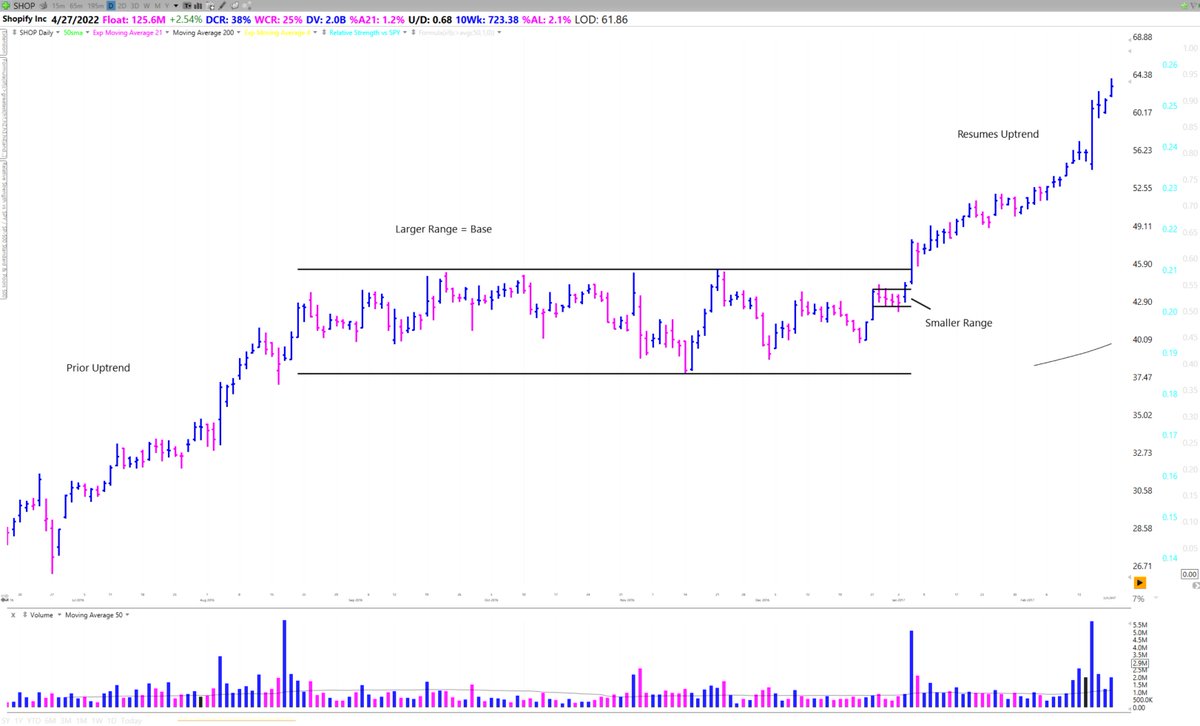
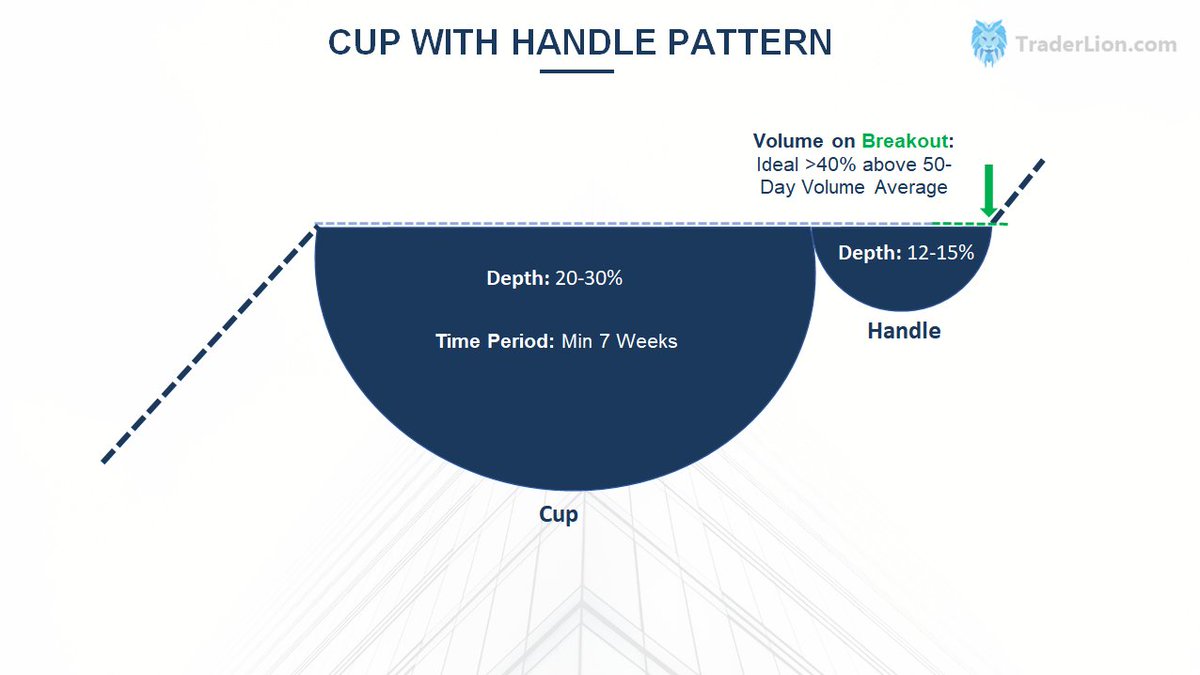
@markminervini @PradeepBonde Trading Ranges are also fractal, meaning they can occur at different scales.
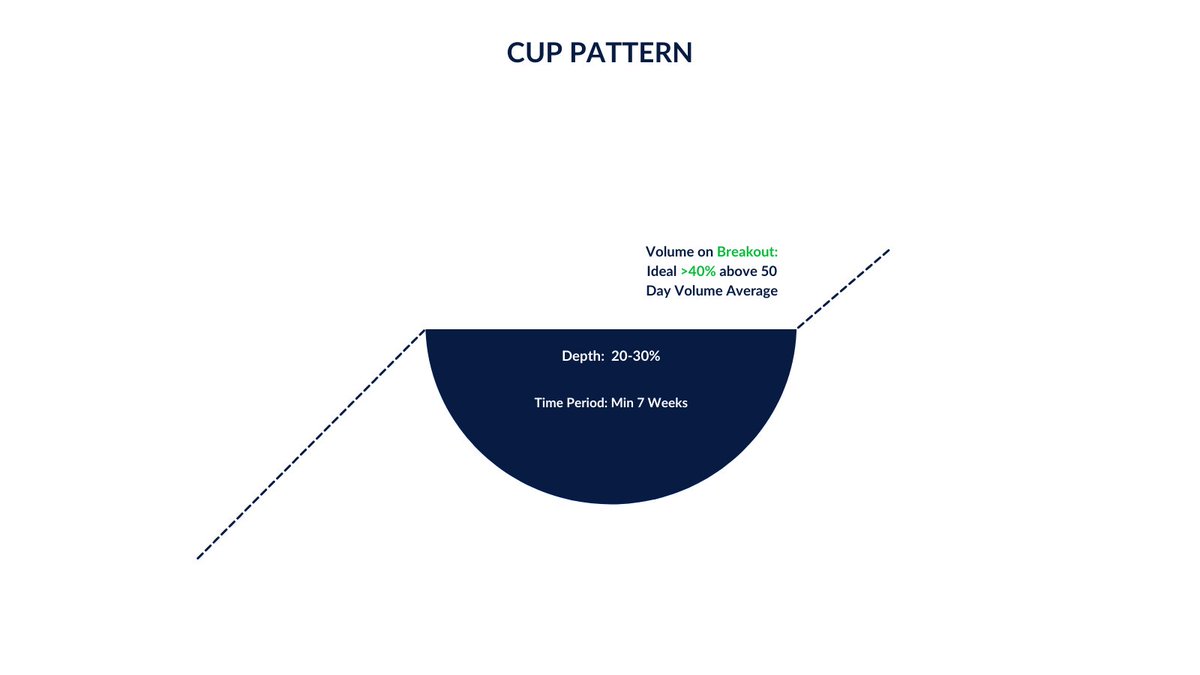
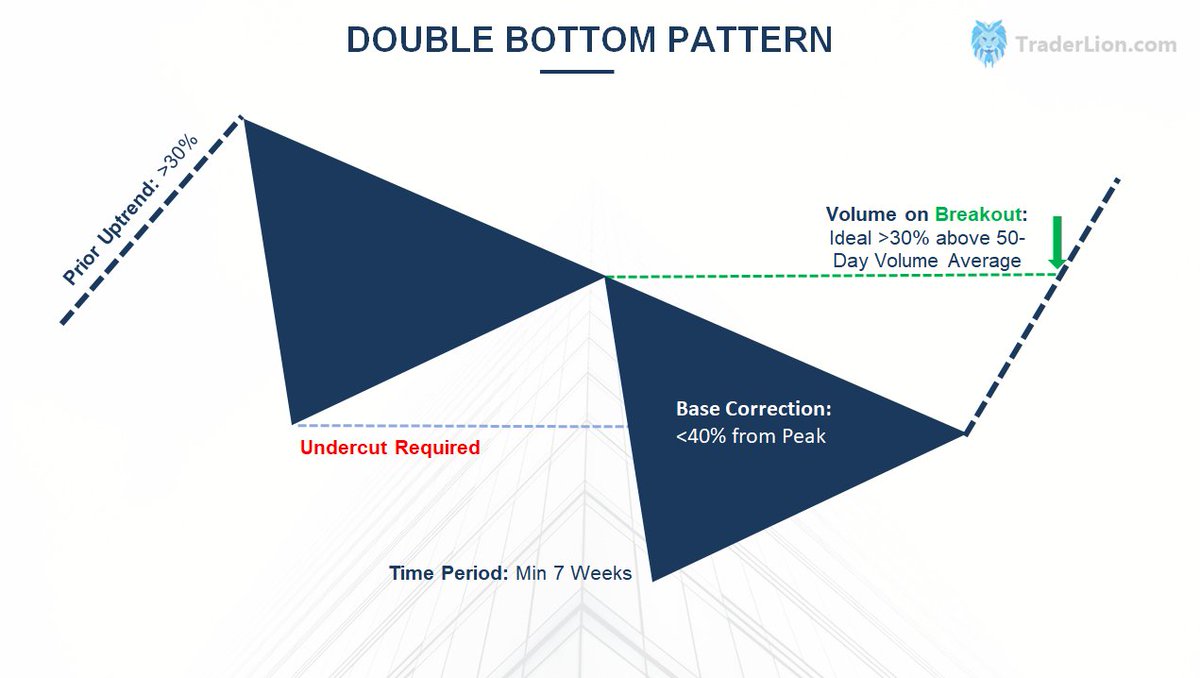
Large Trading ranges are called "Bases". Like from smaller tight areas, after we break above a larger range we often continue in the direction of the longer term trend.
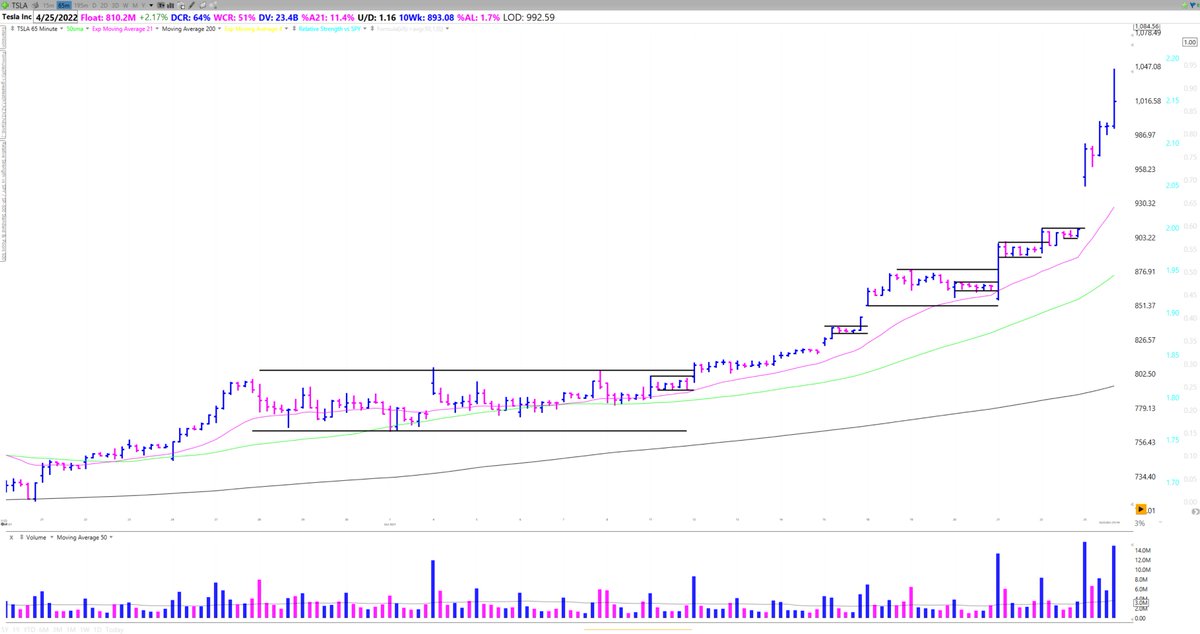
@markminervini @PradeepBonde Trading Ranges also occur on smaller timeframes which you can see using an hourly or 65 minute chart.
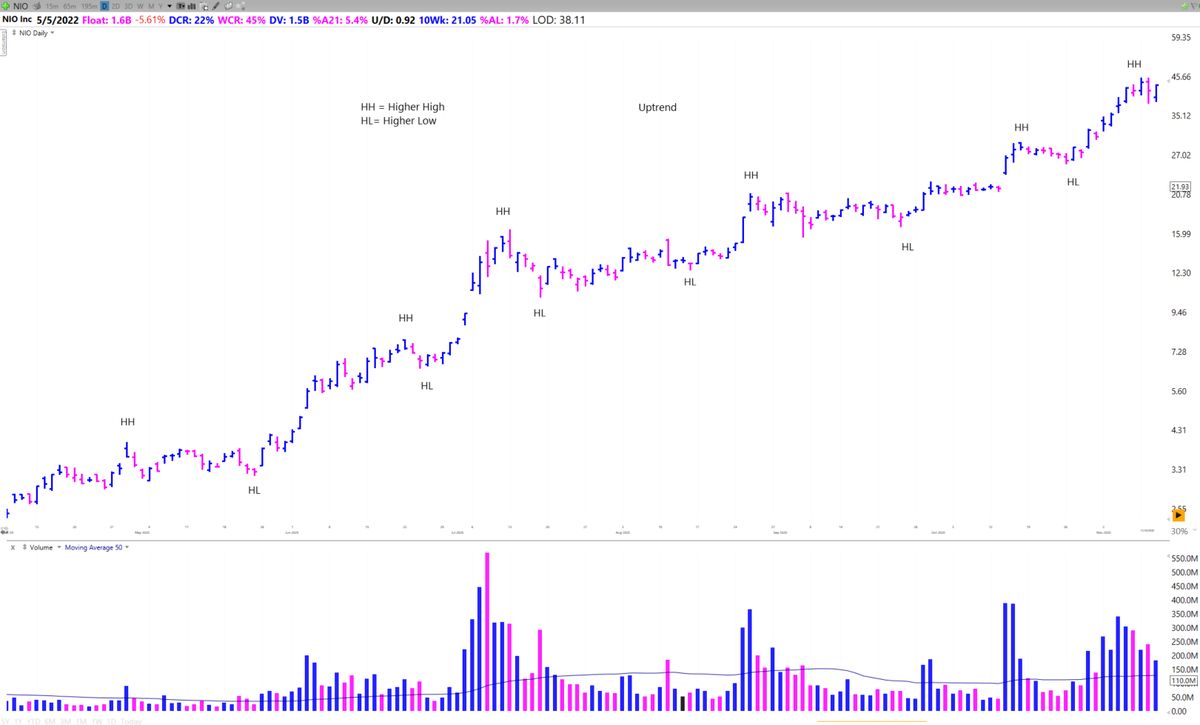
@markminervini @PradeepBonde So I mentioned the word Uptrend and Downtrend. How do I define these?
An Uptrend is a series of higher highs and higher lows
A Downtrend is a series of lower highs and lower lows
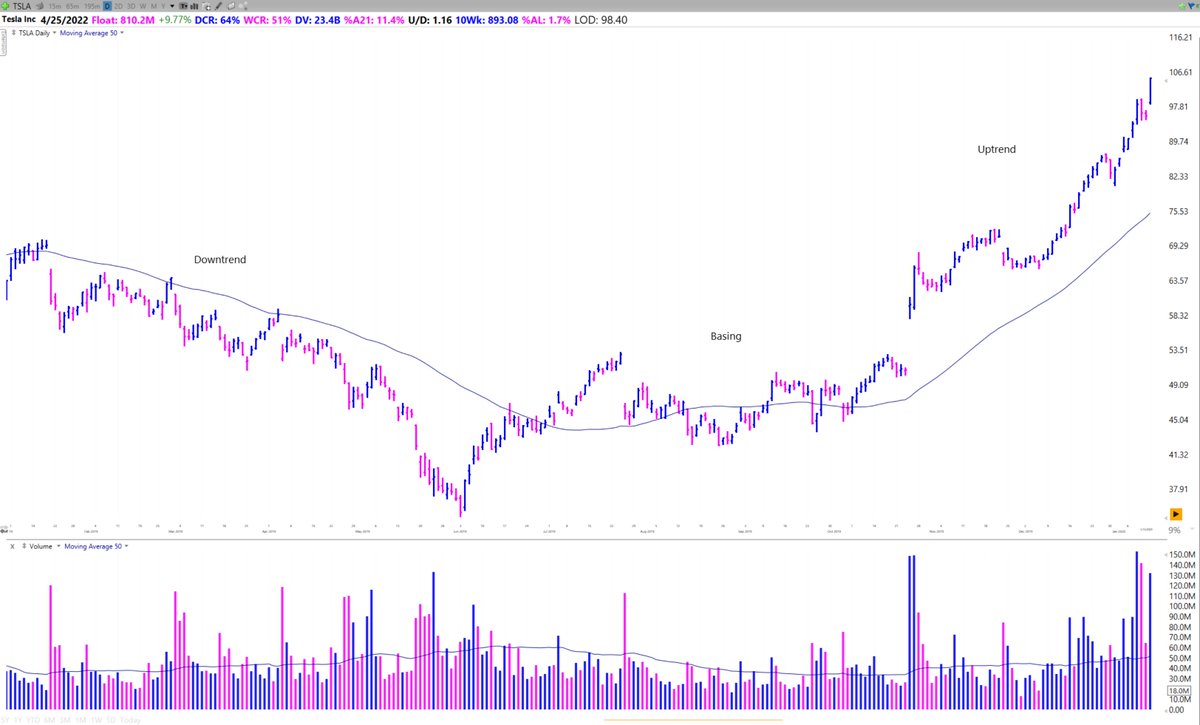
@markminervini @PradeepBonde I also find it helpful to use moving averages as reference points and guides.
As a general rule of rule of thumb, if a stock is trending above a rising moving average then it is in an uptrend during that timeframe.
Below declining = downtrend
Chopping around sideways MA = Base
@markminervini @PradeepBonde To determine the trends on different timeframes I like to use different period moving averages.
I use:
The 10ema
The 21ema
The 50sma
The 200sma
When the trends are all in alignment, the stock is in a strong uptrend.
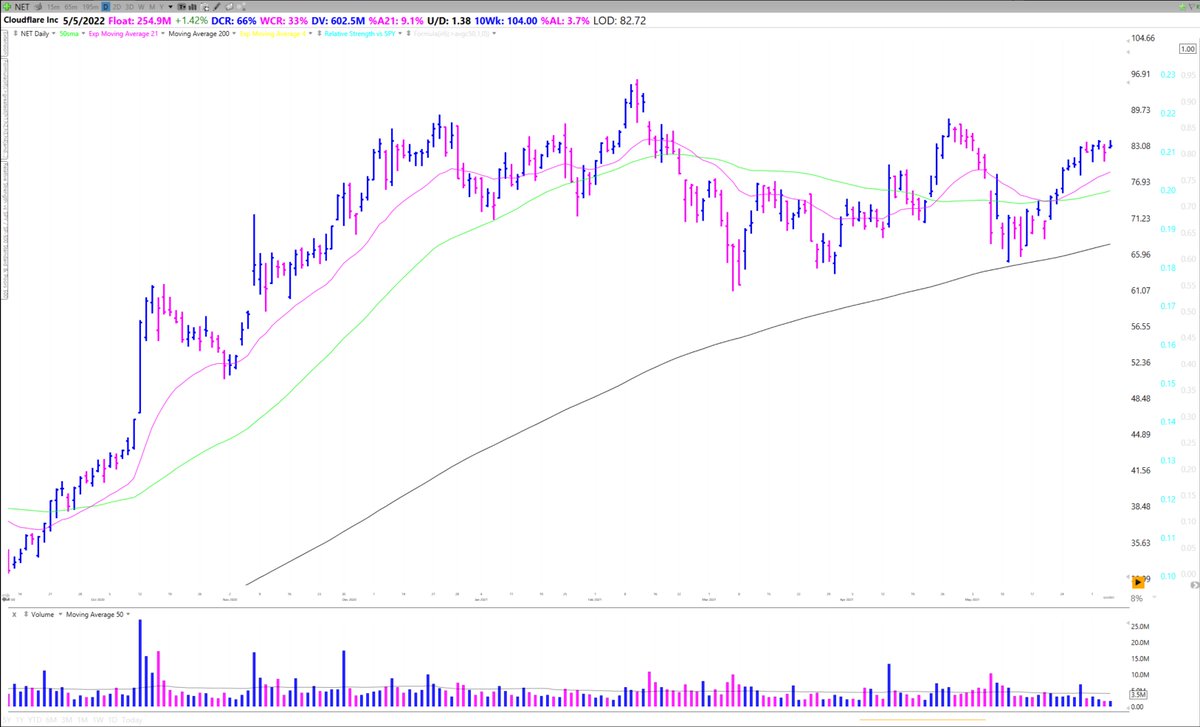
@markminervini @PradeepBonde So now that we have the pieces let's run through a full example using $NET.
Let's say it's Sunday night and you are building a focus list for the next week and stumble upon this chart.
@markminervini @PradeepBonde Start with context.
What is the longer term trend? Are we Basing, in an Uptrend, or in a downtrend.
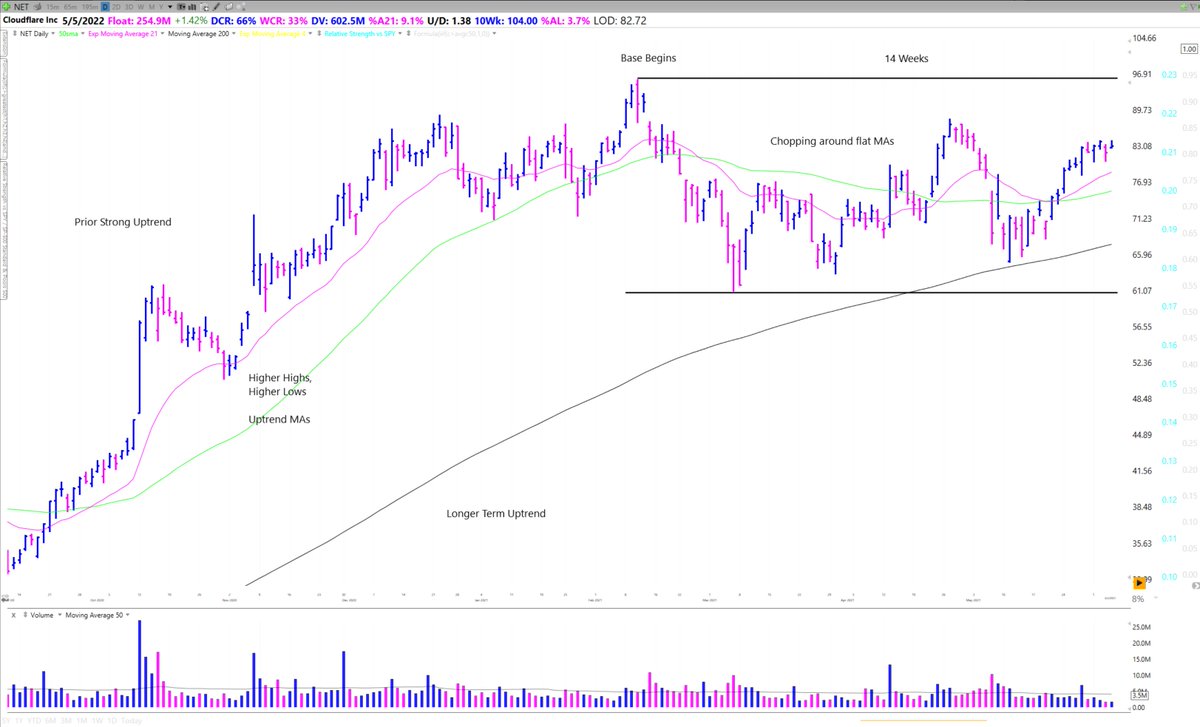
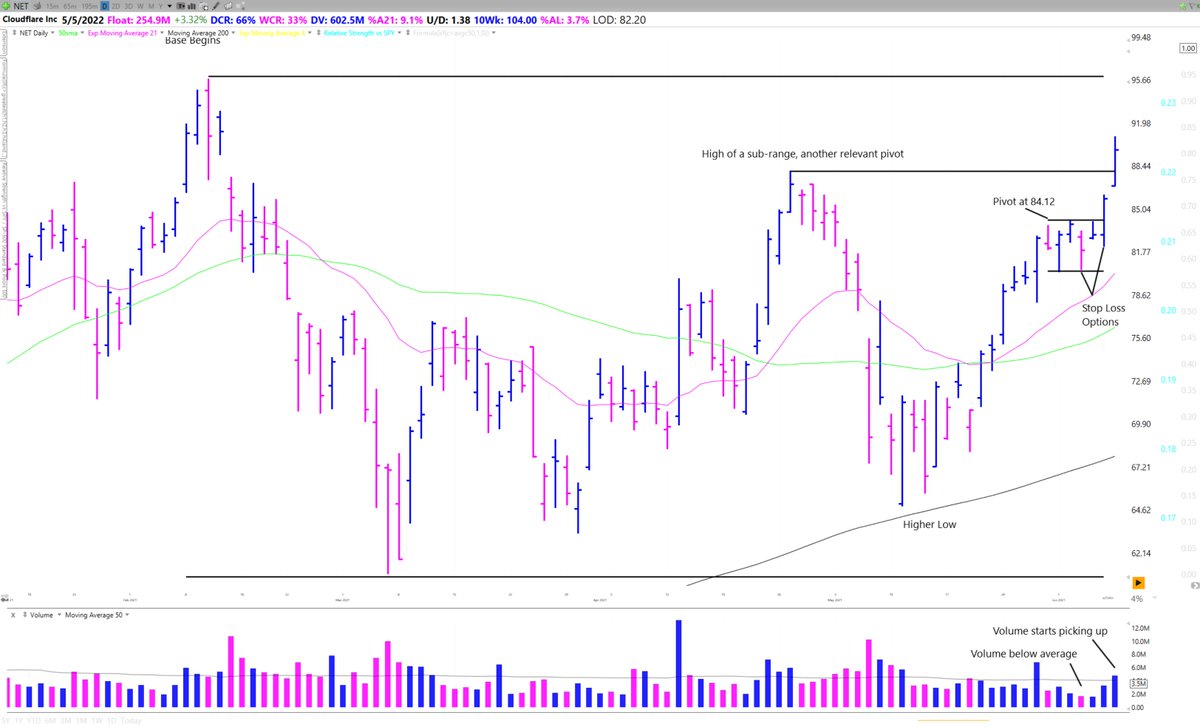
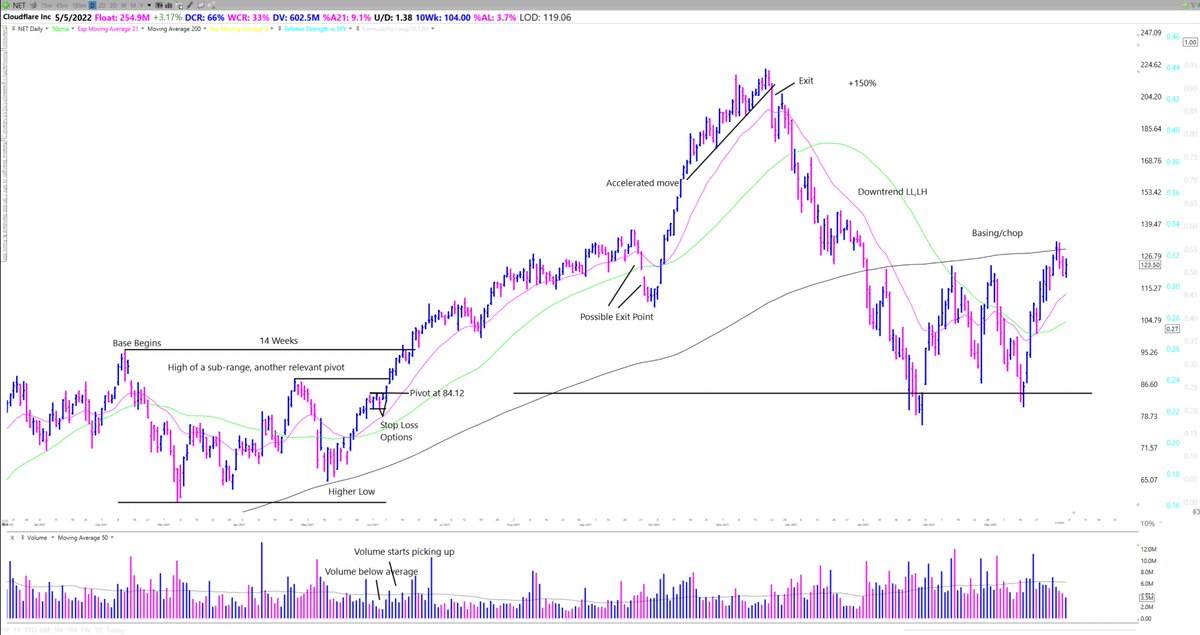
For NET, we are above a rising 200 SMA and building a 14 week base.
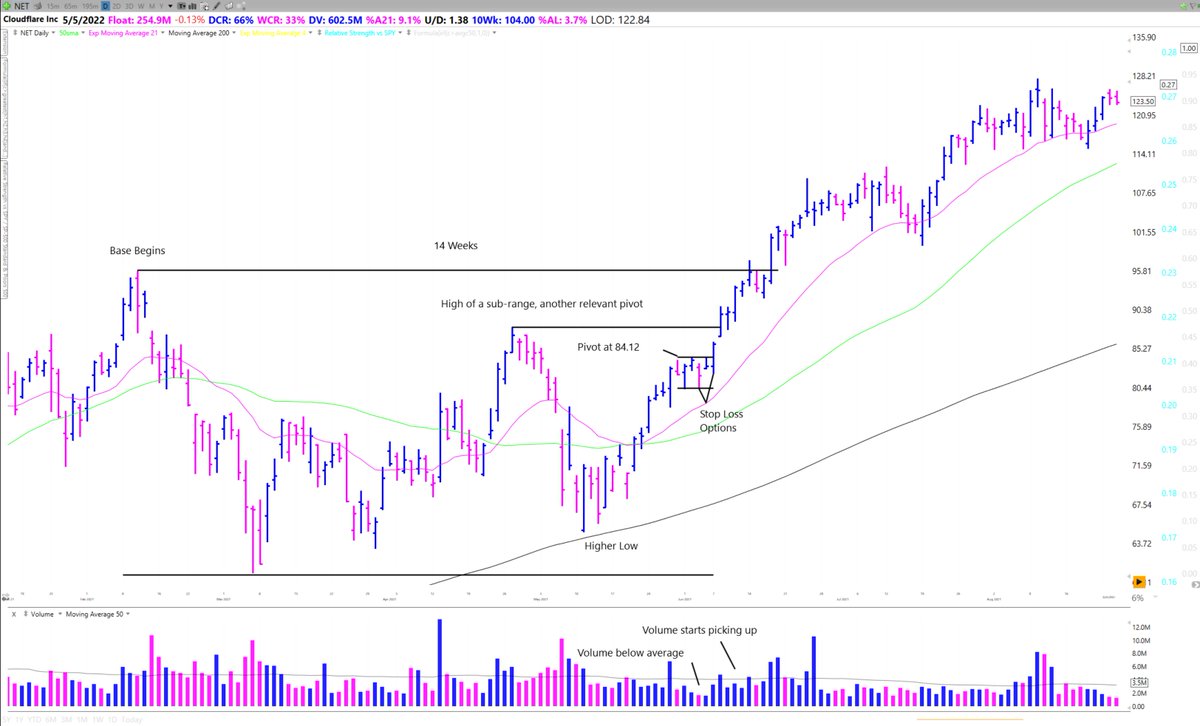
@markminervini @PradeepBonde Let's take a look at this base. 14 weeks is nice and mature.
There is a saying "the longer the base the higher the space" meaning the further a stock can move once it breaks out.
The stock is also moving up the right side of the base approaching the top of the range
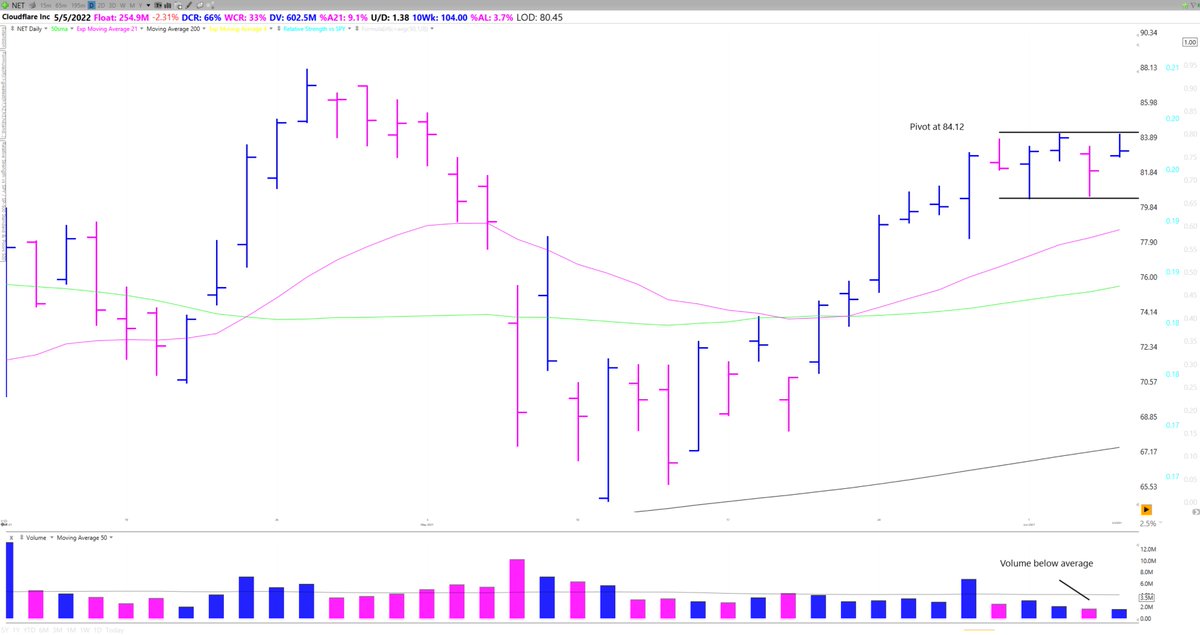
@markminervini @PradeepBonde Zooming into the right side we are above the moving averages and forming a tighter range on low volume with 84.12 as the pivot.
So we have a stock in a longer term uptrend, forming a constructive base, with a tight range up the right hand side with pivot clearly defined.
@markminervini @PradeepBonde Sunday night I would flag this stock and look to go long above the pivot if we see that the stock has made a decision, ideally on very high volume.
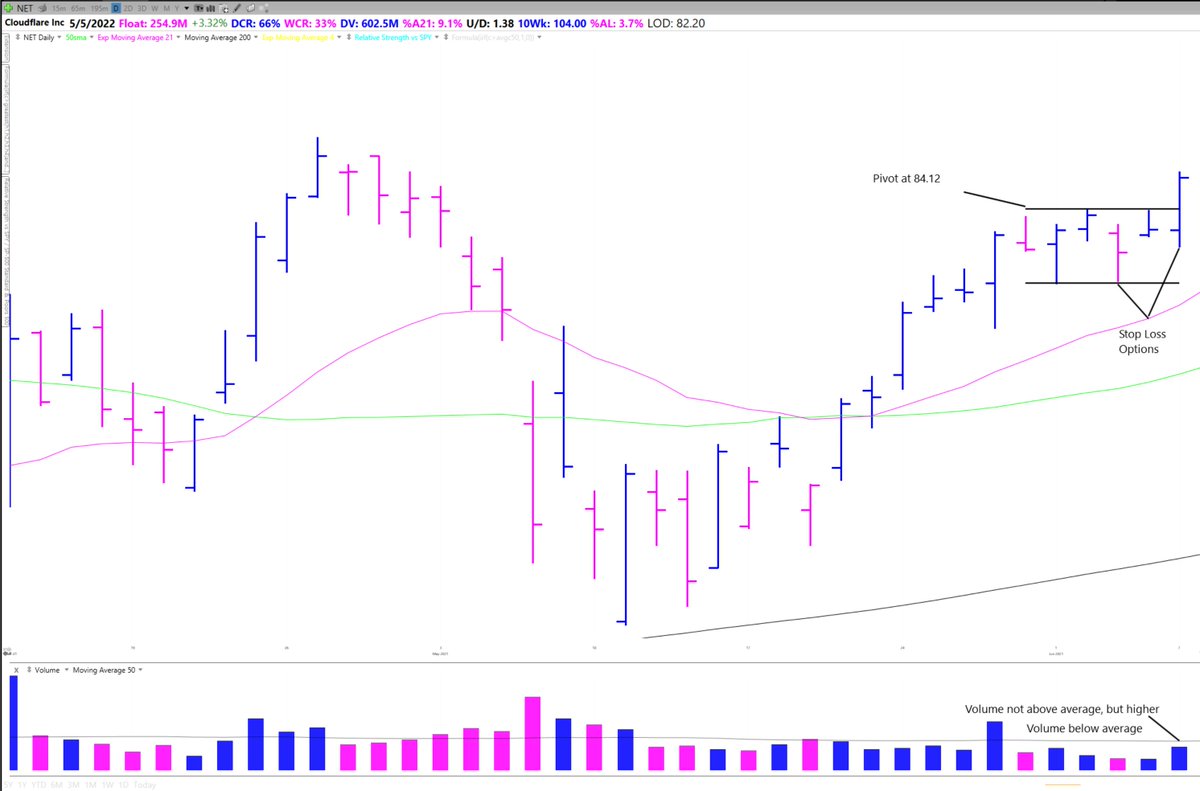
@markminervini @PradeepBonde Moving forward to Monday we get that breakout through the pivot. Volume is not super high but it is higher than the volume within the range
It is okay for volume to be low on the breakout day as long as the stock acts strong.
Volume can also come in over the next few days.
@markminervini @PradeepBonde I would look to go long as close to the pivot price as possible with a stop either at the low of the breakout day or the low of the tight range
@markminervini @PradeepBonde With a stop loss at the low of the day I am risking less but have a higher chance of being stopped out.
If I put it at the low of the range then I am giving the stock more room to wiggle. However, to keep the same $ risk I need to decrease my position size
@markminervini @PradeepBonde On Tuesday we get nice follow through on the price move with volume now above average.
We also break above another relevant pivot of a sub range.
At this point we are up around 5% after risking ~ 2.5% using the Low of the day (LOD) stop
@markminervini @PradeepBonde Since we are up around 2x our initial risk we can move our stop loss up to breakeven (cost basis ~ 84.12), protecting our principal.
Now let's try to let the stock work and trend
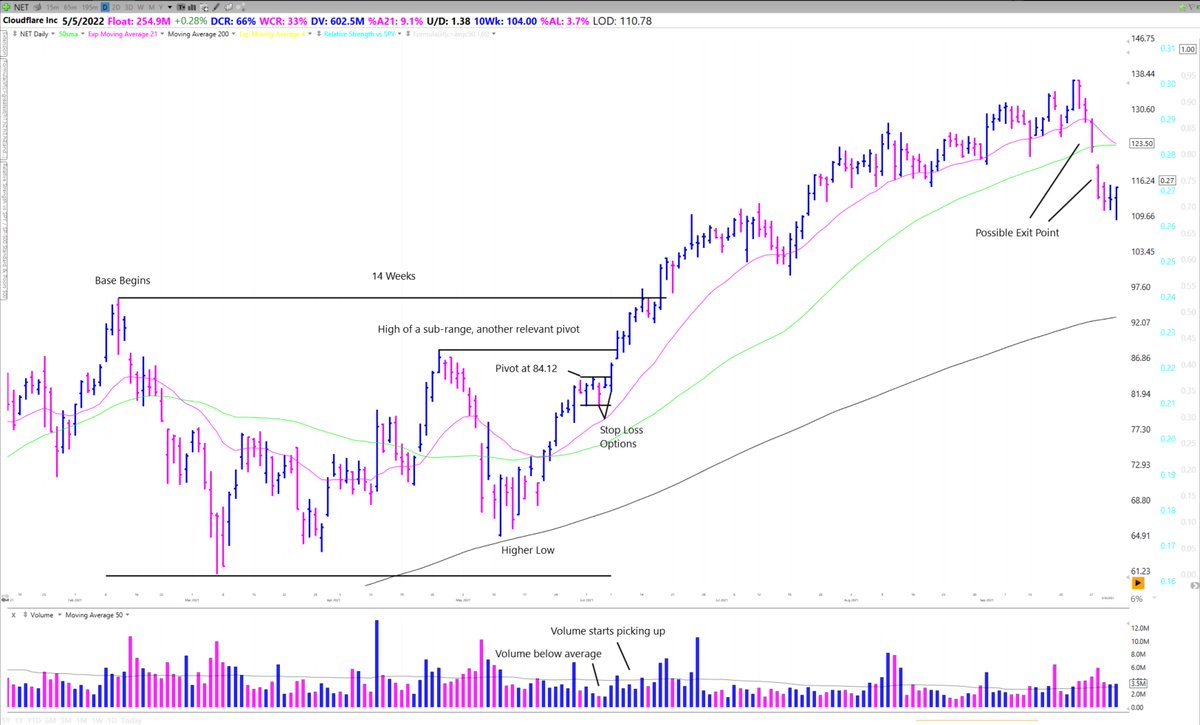
@markminervini @PradeepBonde Over the next few weeks NET broke out of the base and continued to move up from the 80s to 120s
Once the moving averages catch up to your buy point you can switch your stop from breakeven to a close, or 2 closes below a relevant MA
So look to sell if the stock breaks trend.
@markminervini @PradeepBonde Moving forward we get the first breaks of the 21 ema and 50 sma, possible sell points
Since you are at a healthy profit you could sell a portion of your position and try to let the rest keep working.
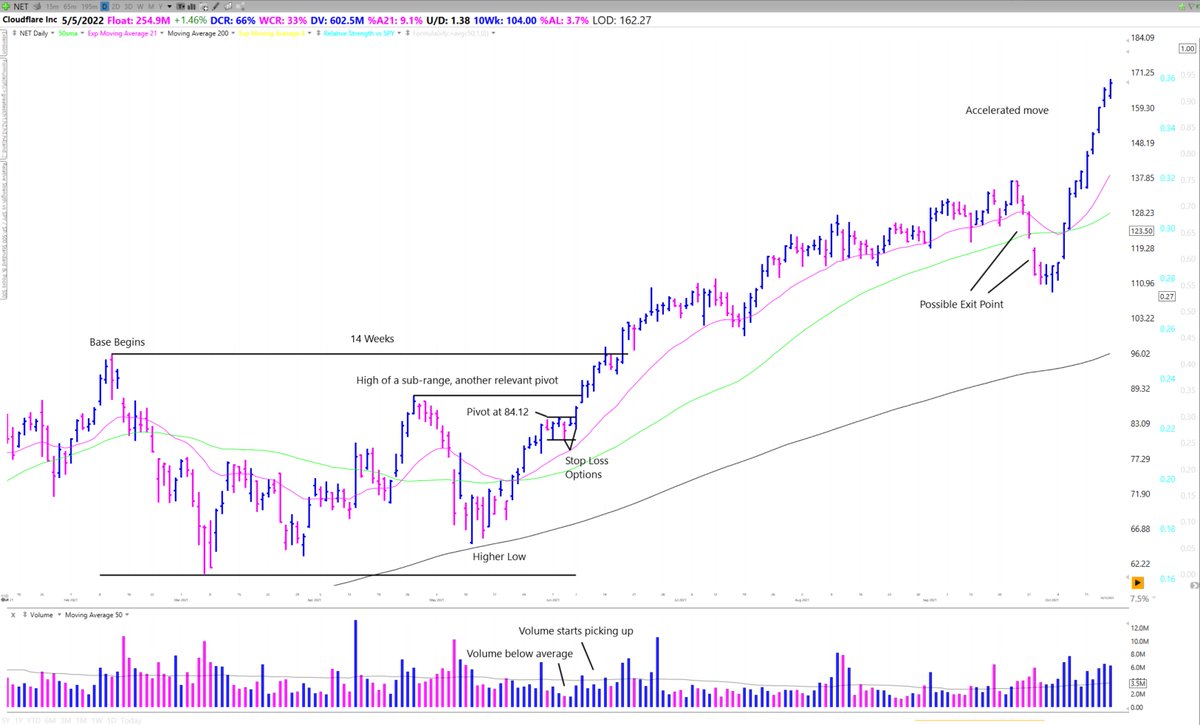
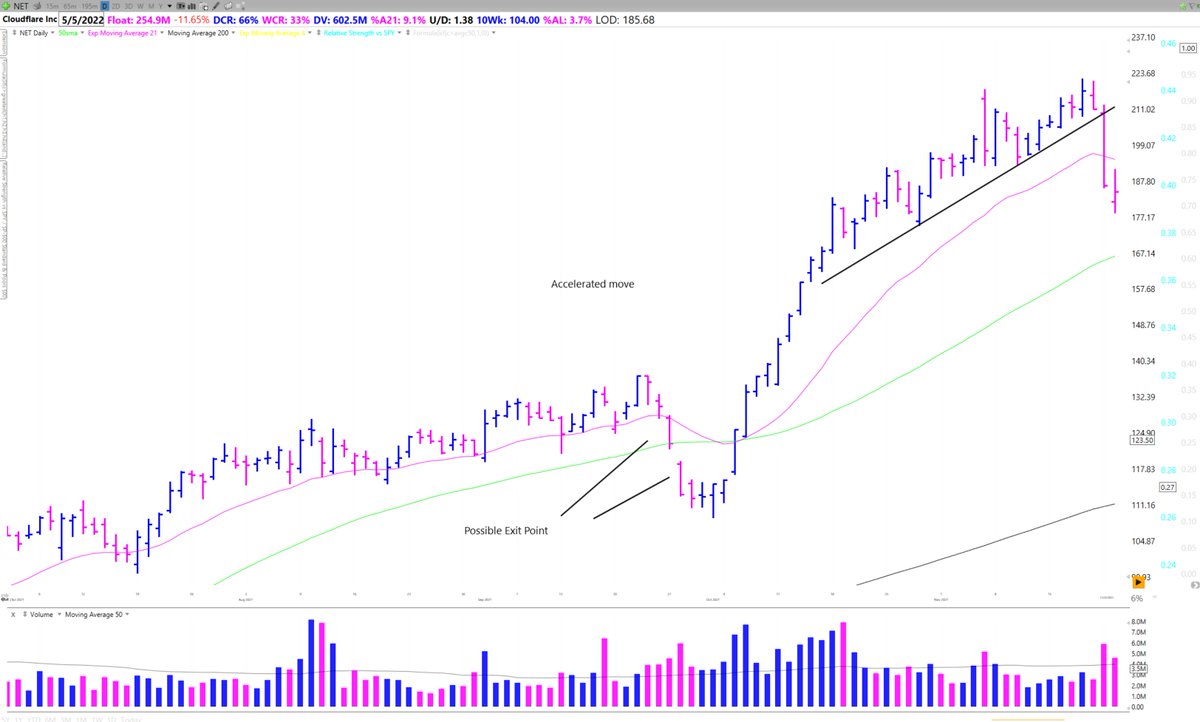
@markminervini @PradeepBonde NET recovers and actually starts an accelerated move.
At this point because the longer term uptrend has been going on for ~ 20 months I'd be tracking a stock closely and watching for a break in the accelerated trend
@markminervini @PradeepBonde Here we get it, as the stock drops 11% on high volume breaking the 21ema, a trendline, and last weeks low. Several critical levels at once.
The Trade is over.
@markminervini @PradeepBonde From then, NET drops over 60% undercutting the initial buy point before transitioning back to a basing period.
If you didn't have sell rules you gave back 40%-150% gains.
So that is how to use technical analysis to analyze stocks and manage trades.
I hope you found it helpful!
If you did make sure to
1. Follow
@RichardMoglen 2. Retweet the tweet below to share with your audience
3. Check out
https://t.co/TvGS94qkPP https://t.co/Igu1r1eLT8