5 Ways Weekly Charts can help your Trading & Investing
📈📉 (Thread)
This will lead to better decision making.
For traders they are the "prevailing wind" and trading with this weekly trend will increase probabilities and help you remember to focus on larger patterns
Weekly charts eliminate a lot of the back and forth that occurs intraday and on daily charts. What is left is often a clear picture of the trend of a stock.
⬆️ Trending Up
↔️ Basing
⬇️ Trending Down
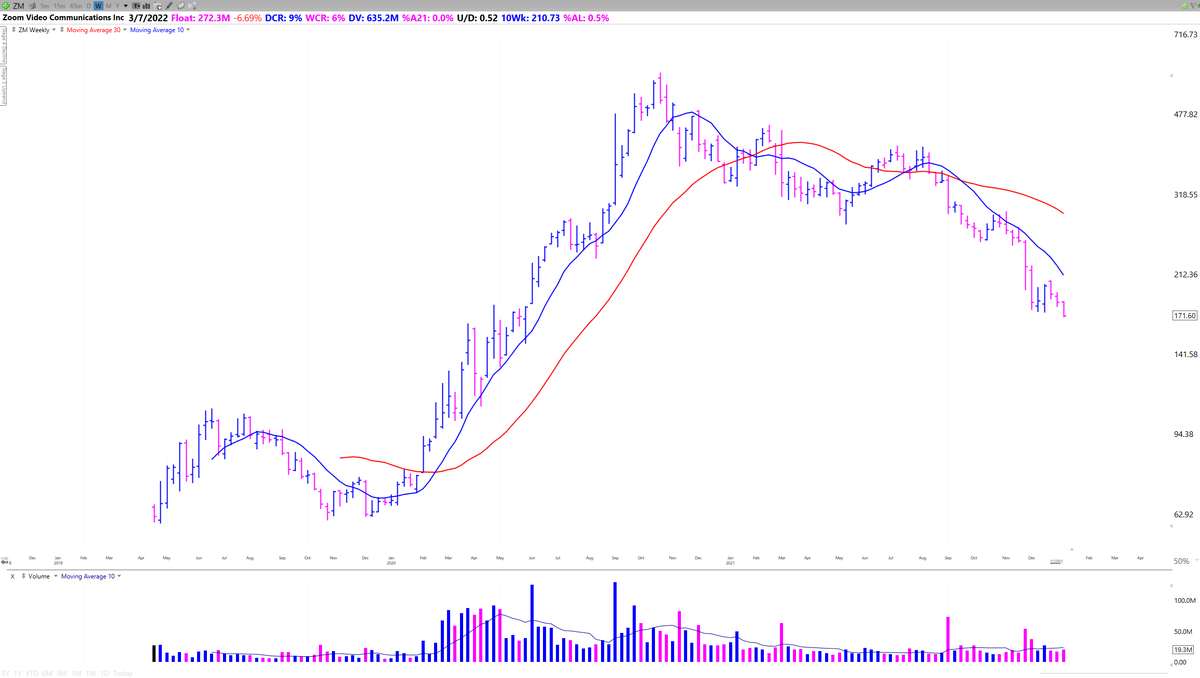
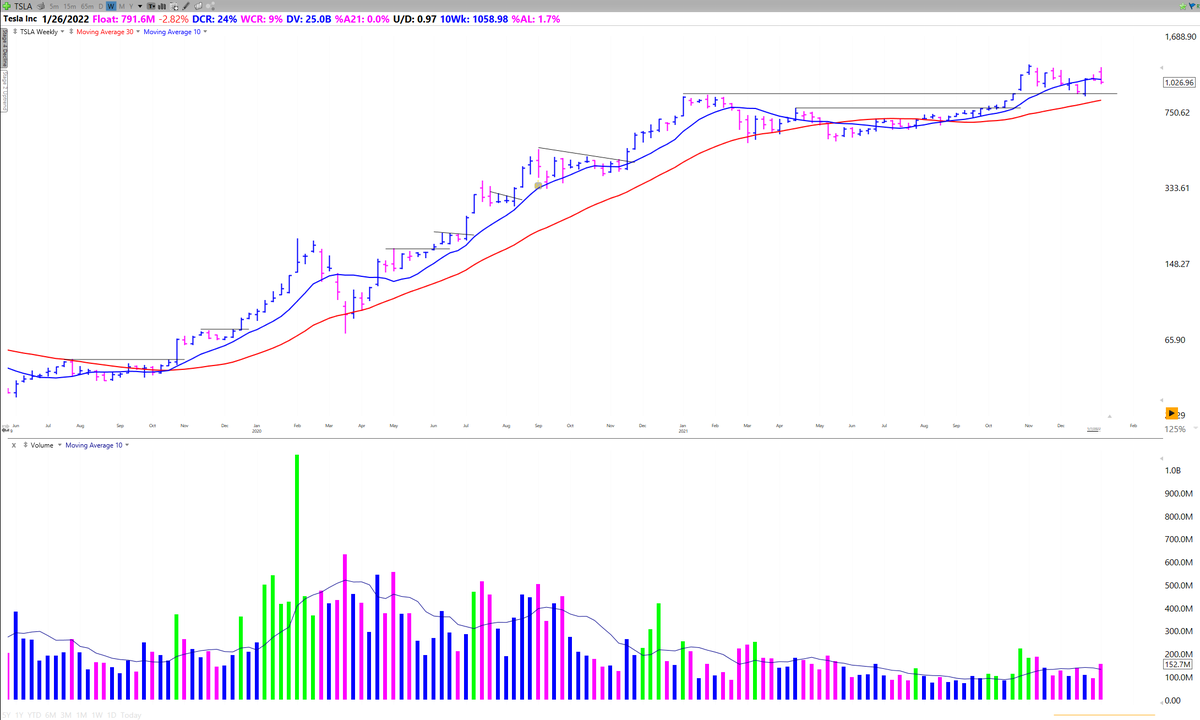
During a strong uptrend you will be amazed at how well the 10 week line acts as a guardrail for a stock's move
$ZM increased 450% in 10 months, undercutting the 10 week only once

This is because it is often a spot where institutions build/add to positions on pullbacks.
$DOCN advanced 150% in 6 months holding the 10 week sma

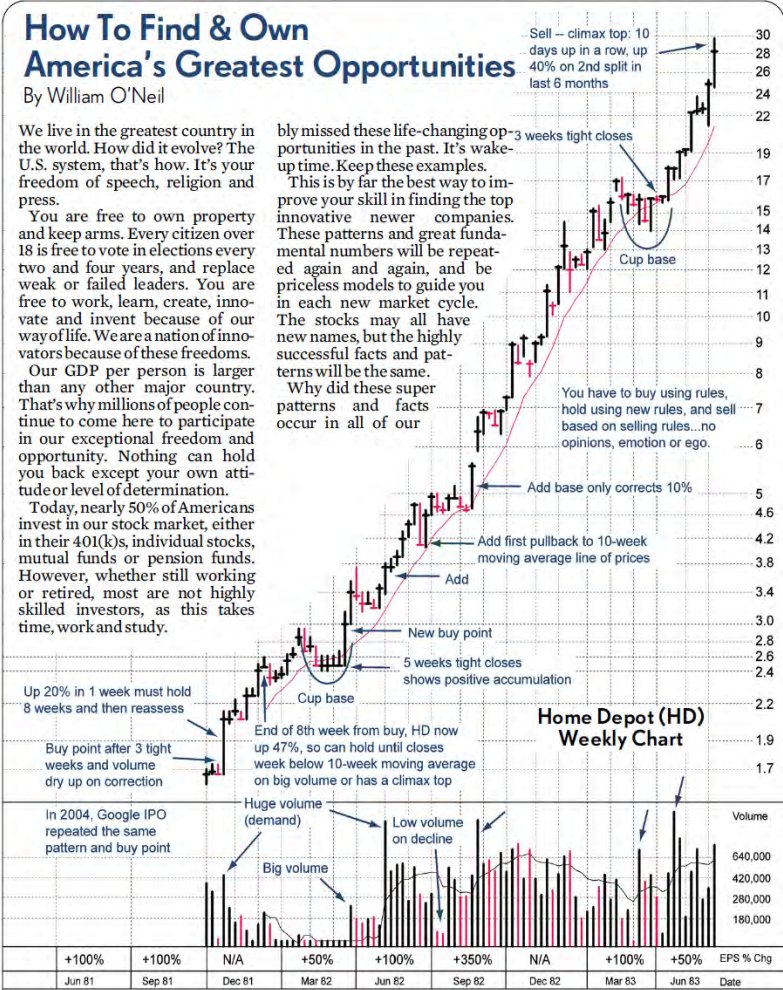
Here's is $HD's powerful move in 1981
The red line is the 10 week SMA.
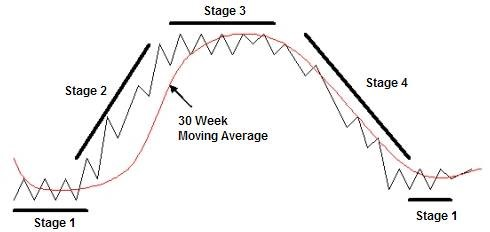
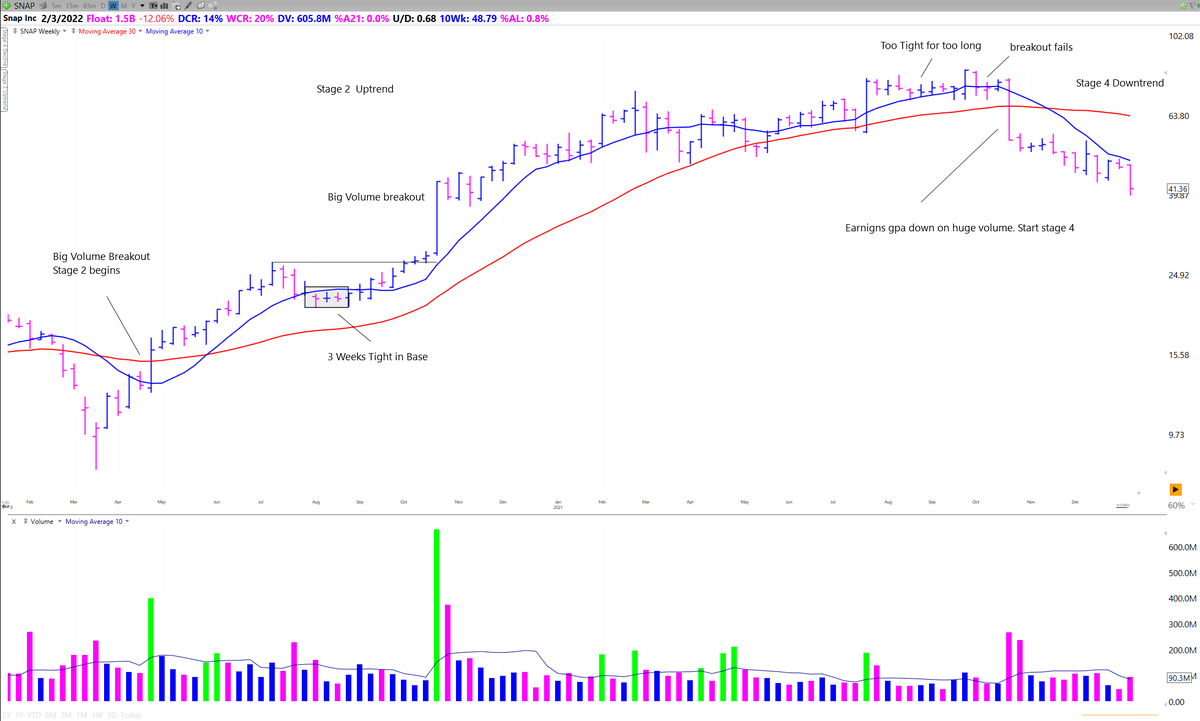
Stage 1 - Basing
Stage 2 - Advance
Stage 3 - Consolidation
Stage 4 - Distribution
The big money in made during S2 Uptrends and the big money is lost in S4 Declines

S2 - Starts with a big volume breakout from a base, Price starts trending above a rising 30 week MA
S3 - Price chops around a flattening 30 week ma
S4 - Price starts trending below a declining 30 week MA
Both investors and traders should focus on stocks beginning or in Stage 2 Uptrends.
My Interview with Stan:
🔗https://t.co/G5jsyL5BMo
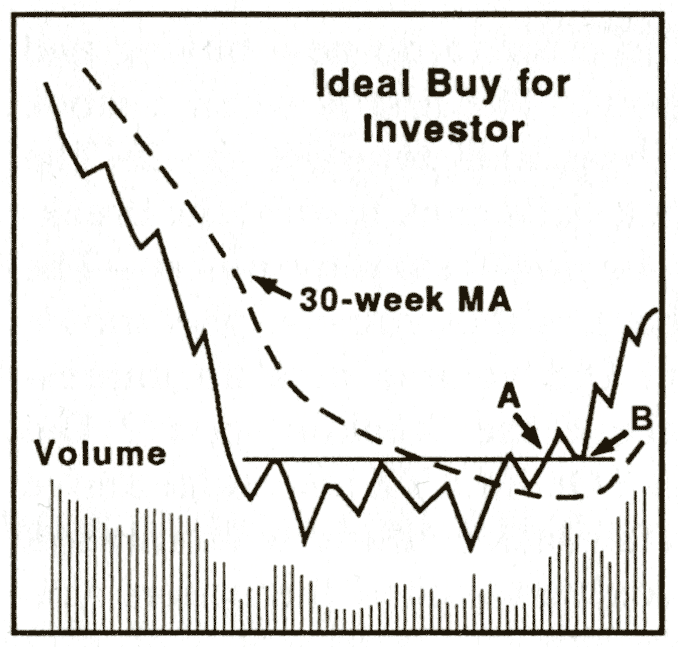
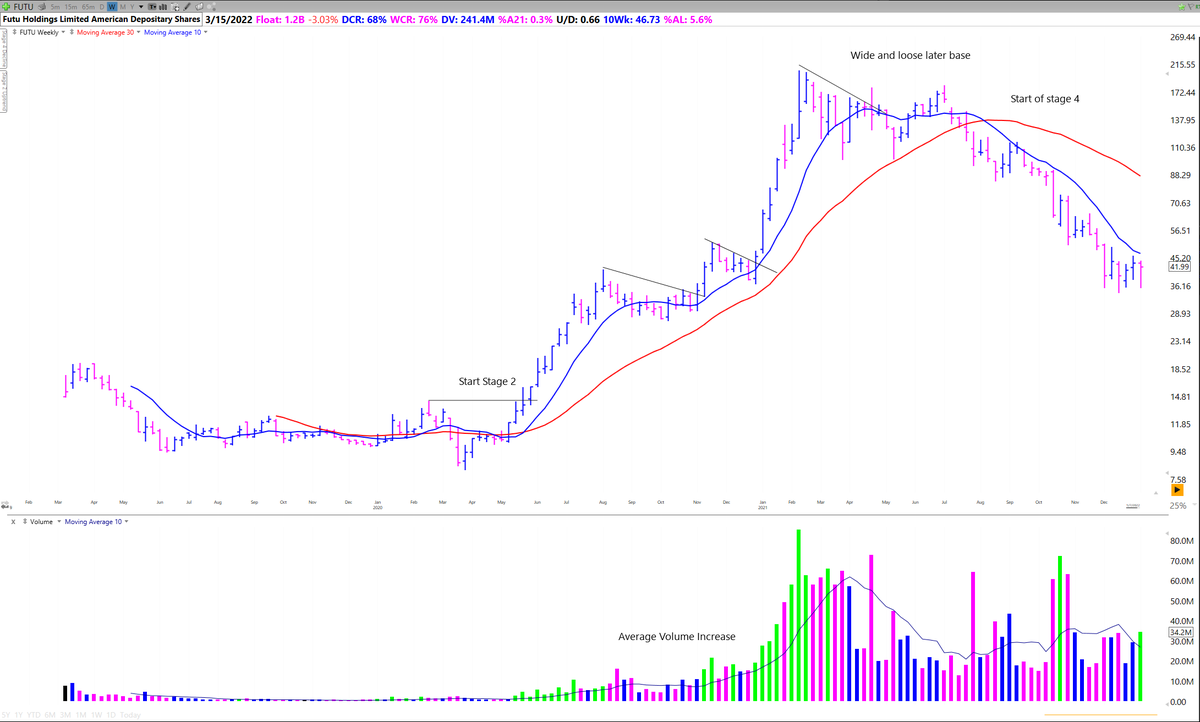
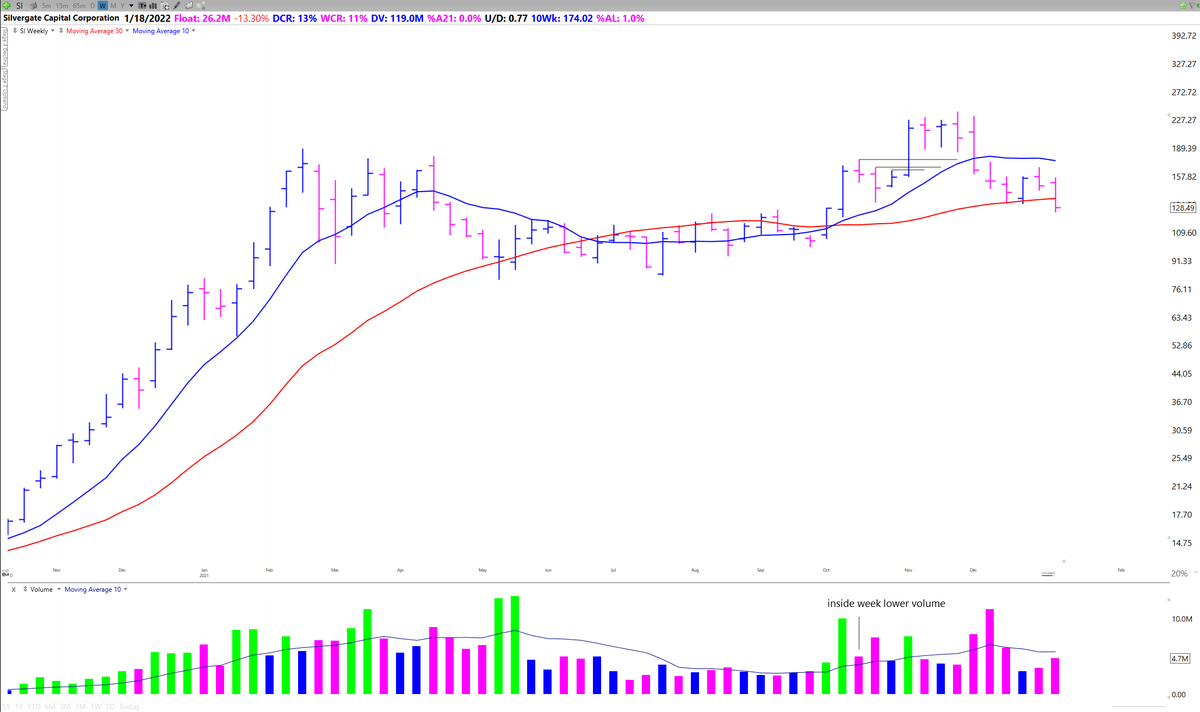
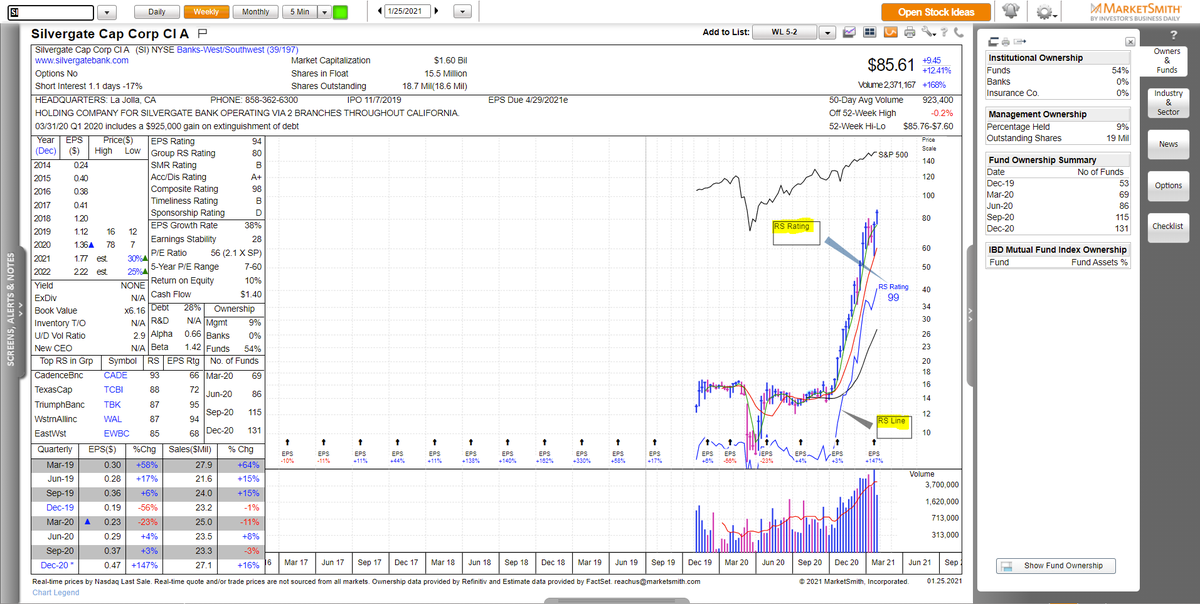
Institutions can't hide when they begin and continue accumulating positions.
Look for.
✅ Huge Volume Spikes
✅ Tight Weekly Closes
✅ Increasing average weekly volume
Look at significant volume weeks and determine based on context and CR if a stock is being accumulated or distributed
Also look for this after a breakout to see if institutions are still building positions
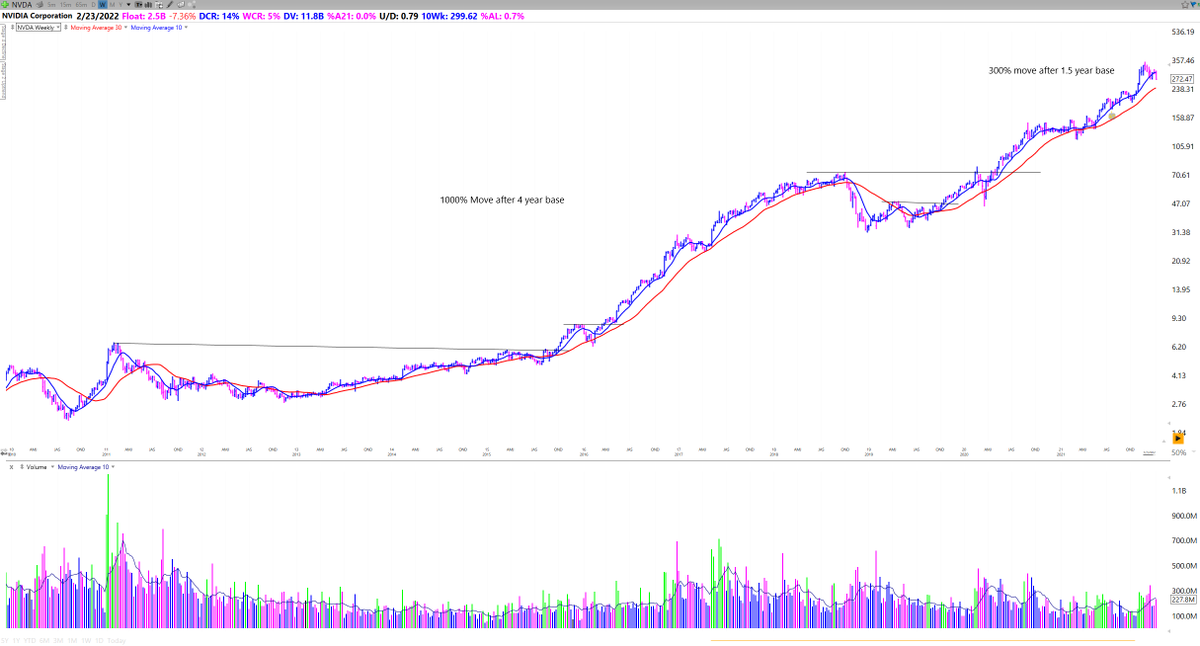
100% + moves begin with a long basing period and a strong breakout.
Focus on 👇
✅ Recent IPOs after their first big base
✅ Mature names after they have consolidated
Read "The Lifecycle Trade" for more info
📘https://t.co/PuofeP4Mkc
@EBoboch
@KGD_Investor
@EricKrull1
@Top_Dog_102

As mentioned previously, weekly charts remove intraday and daily chop. The stock can move a lot throughout the week but it is the institutions who control where it closes.
Always make sure you are stacking probabilities and trading with the weekly trend.
Position and even swing traders should also consider buying on a daily chart but then switching over to a weekly once the trend is established
Here's an example with $PTON buying on the daily and then managing the position on a weekly.
When the weekly trend changes PAY ATTENTION.
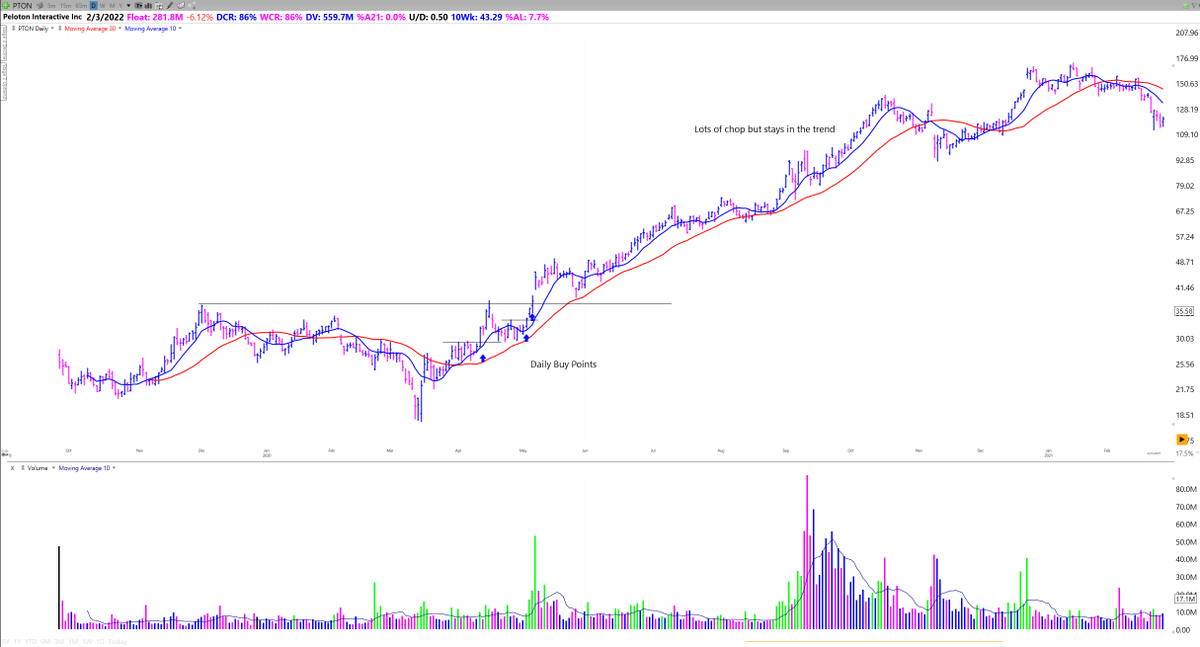
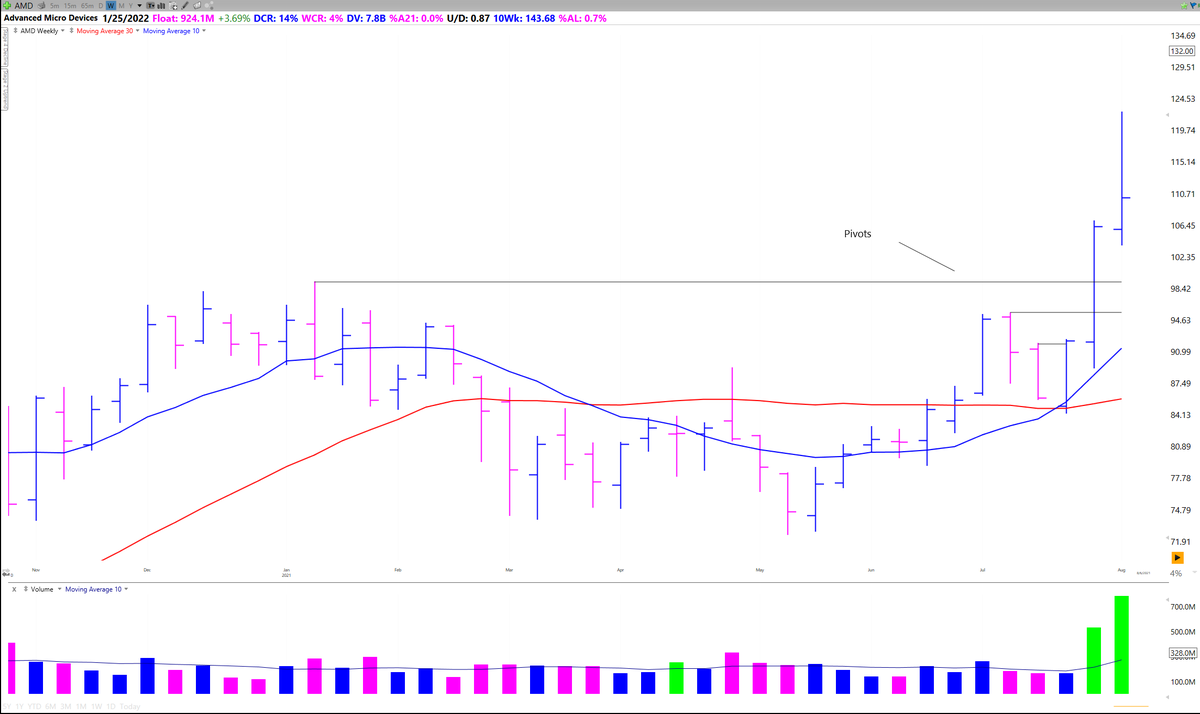
Weekly chart highs and closes are excellent pivots to use on a daily chart for shorter term traders.
If you did please like and retweet the first tweet (linked below) 👇🔁
Also tag anyone else who you think would find it interesting. Take care!
https://t.co/6G431IkBDQ
5 Ways Weekly Charts can help your Trading & Investing
— Richard Moglen \U0001f4fd\ufe0f\U0001f981\U0001f6a2 (@RichardMoglen) January 9, 2022
\U0001f4c8\U0001f4c9 (Thread)
https://t.co/TvGS94qkPP
More from Richard Moglen 📽️🦁🚢
What is a True Market Leader / TML (Thread)
(And how to find them)
In one sentence a TML is an institutional quality stock in a leading industry group with superior fundamentals and technicals
These are monster stocks which over the course of weeks and months increase +100% to +5,000%
TMLs are popular with traders/investors whose methodology is based on the CANSLIM system developed by William O'Neil.
He called them Model Book Stocks. Huge winners worth studying to identify common characteristics that they all share
O'Neil studied over 1000 model book stocks going back to the 1880s.
Many are shown and discussed in these must read books
How To Make Money in Stocks, O"Neil
https://t.co/S2sShZedUm
Monster Stocks, John Boik @monsterstocks1
A Few Examples courtesy of @SystematiCK_
Pic N Save
#Study & #learn from past super #stocks
— SystematiCK Trader (@SystematiCK_) September 26, 2020
Example 22: Pic N Save - 1979
Sharpen your eyes & internalize
- which fundamental and technical setup fuelled the big gain
- how trade management was done
- the importance of acc./distr. volume
Credit to the great W. O\u2019Neil! pic.twitter.com/m888ZaGyMV


More from Traderlion

What is a True Market Leader / TML (Thread)
(And how to find them)
In one sentence a TML is an institutional quality stock in a leading industry group with superior fundamentals and technicals
These are monster stocks which over the course of weeks and months increase +100% to +5,000%
TMLs are popular with traders/investors whose methodology is based on the CANSLIM system developed by William O'Neil.
He called them Model Book Stocks. Huge winners worth studying to identify common characteristics that they all share
O'Neil studied over 1000 model book stocks going back to the 1880s.
Many are shown and discussed in these must read books
How To Make Money in Stocks, O"Neil
https://t.co/S2sShZedUm
Monster Stocks, John Boik @monsterstocks1
A Few Examples courtesy of @SystematiCK_
Pic N Save
(And how to find them)
In one sentence a TML is an institutional quality stock in a leading industry group with superior fundamentals and technicals
These are monster stocks which over the course of weeks and months increase +100% to +5,000%
TMLs are popular with traders/investors whose methodology is based on the CANSLIM system developed by William O'Neil.
He called them Model Book Stocks. Huge winners worth studying to identify common characteristics that they all share
O'Neil studied over 1000 model book stocks going back to the 1880s.
Many are shown and discussed in these must read books
How To Make Money in Stocks, O"Neil
https://t.co/S2sShZedUm
Monster Stocks, John Boik @monsterstocks1
A Few Examples courtesy of @SystematiCK_
Pic N Save
#Study & #learn from past super #stocks
— SystematiCK Trader (@SystematiCK_) September 26, 2020
Example 22: Pic N Save - 1979
Sharpen your eyes & internalize
- which fundamental and technical setup fuelled the big gain
- how trade management was done
- the importance of acc./distr. volume
Credit to the great W. O\u2019Neil! pic.twitter.com/m888ZaGyMV
The market’s best investors have made millions from the simple saying:
“Buy right, sit tight”
Sounds simple - but what does “buying right” even mean?
Use TraderLion's 10-Step Ultimate Guide to buying right 👇
By the end of this thread, you'll know how to:
1. Build an objective list of buy criteria
2. Have 10+ real world examples to study
3. Increase your win rate.
4. Increase your profitability
Let's dive in!
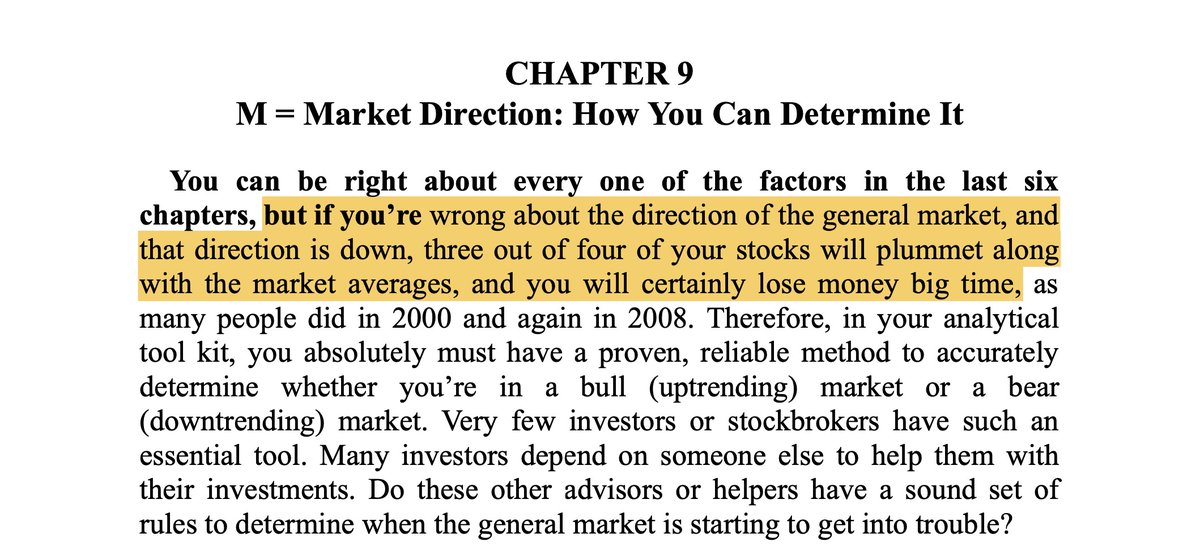
Buy Rule #1: The General market must be in an uptrend.
3 out of every 4 stocks follow the market trend both to the upside and to the downside.
This means that if you are buying a breakout in a downtrend, it already has a 75% chance of failing!
It doesn't matter if the stock is in a leading group with an impressive RS line and strong fundamental story.
At the end of the day, market direction is the MOST important factor!
Here's an excerpt from How To Make Money In Stocks by stock market legend William O'Neil:
Here's another video by @richardmoglen that will help you determine if the stock market is in a downtrend:
https://t.co/shD5OjkP6s
Let's move on to #2.
“Buy right, sit tight”
Sounds simple - but what does “buying right” even mean?
Use TraderLion's 10-Step Ultimate Guide to buying right 👇
By the end of this thread, you'll know how to:
1. Build an objective list of buy criteria
2. Have 10+ real world examples to study
3. Increase your win rate.
4. Increase your profitability
Let's dive in!
Buy Rule #1: The General market must be in an uptrend.
3 out of every 4 stocks follow the market trend both to the upside and to the downside.
This means that if you are buying a breakout in a downtrend, it already has a 75% chance of failing!
It doesn't matter if the stock is in a leading group with an impressive RS line and strong fundamental story.
At the end of the day, market direction is the MOST important factor!
Here's an excerpt from How To Make Money In Stocks by stock market legend William O'Neil:
Here's another video by @richardmoglen that will help you determine if the stock market is in a downtrend:
https://t.co/shD5OjkP6s
Let's move on to #2.